
Four Hundred Dollars or Nine Cents
The Same Machine, Twice
A dollar put into TQQQ in February 2010, the month it was launched, was worth about $408 on 7 October 2026. TQQQ is ProShares’ fund that seeks three times the daily performance of the Nasdaq-100, and over the same years the plain fund on that index, QQQ, turned the dollar into $20. That is the story people tell about leveraged funds when they buy them.
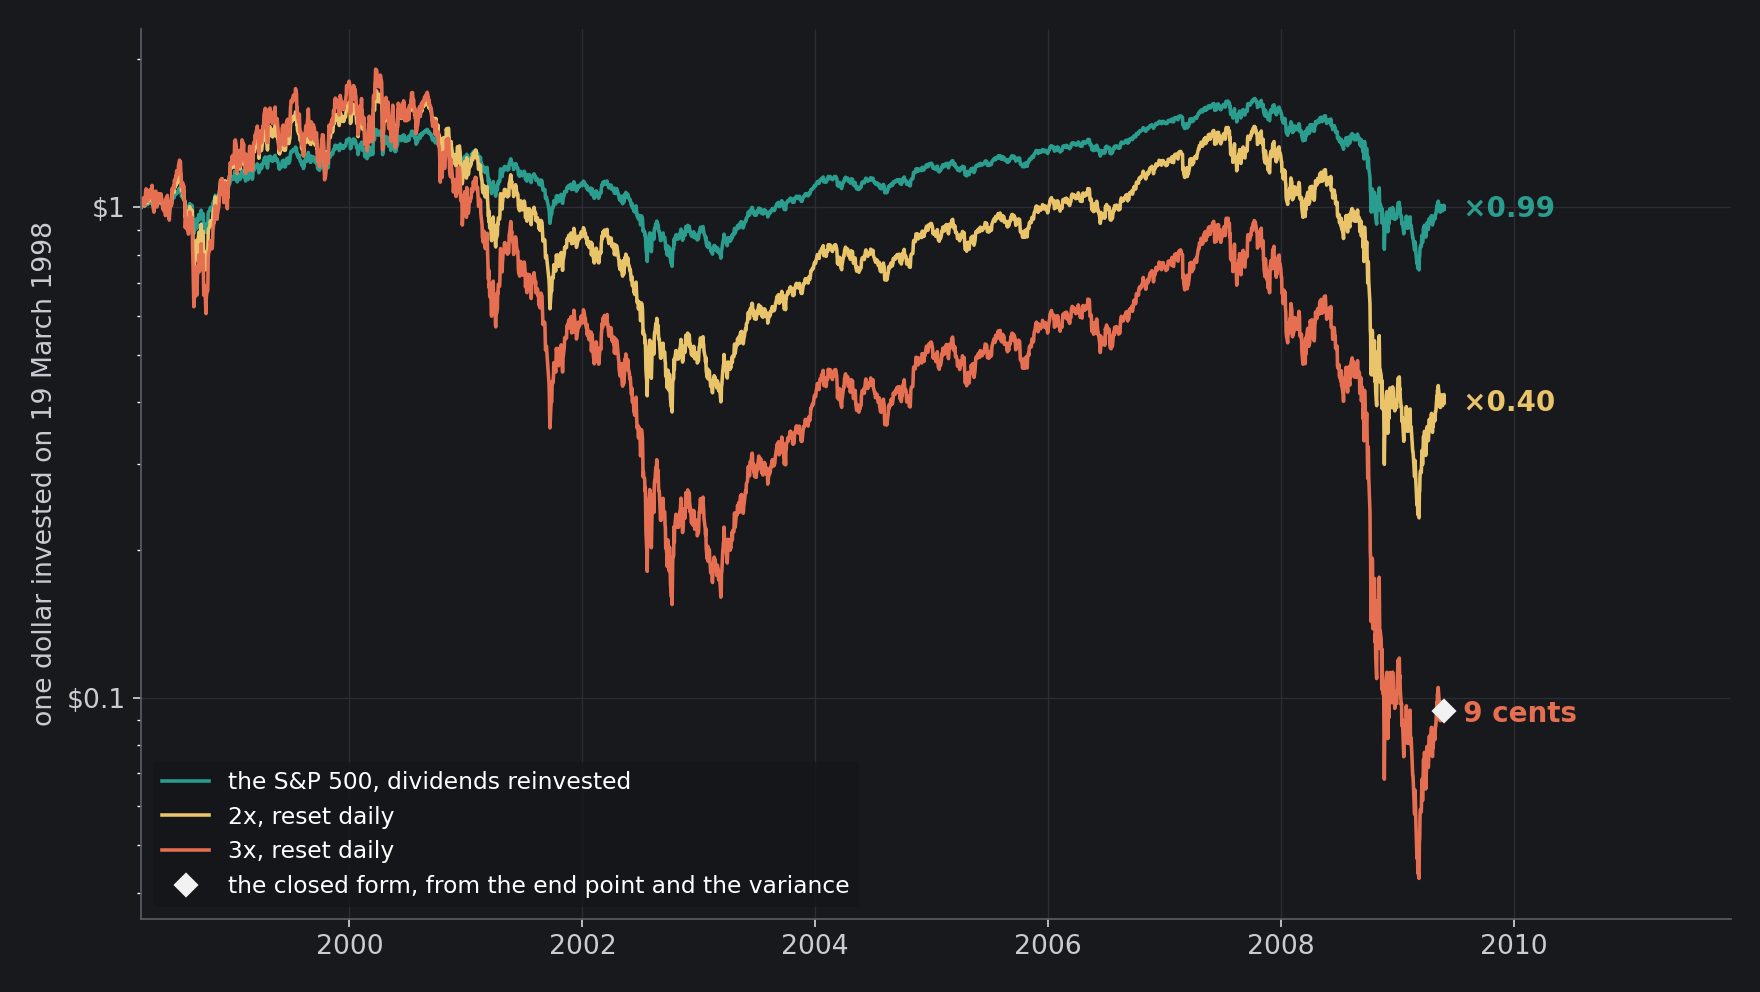
Here is the other story. Run the same machine on the S&P 500 from 19 March 1998 to 27 May 2009: every day, hold three times the index, borrow the difference at the Treasury bill rate, pay no fees, and reset at the close. The index, with its dividends reinvested, ended where it began, at 99 cents on the dollar. The three-times fund ended with 9 cents.
Four hundred dollars or nine cents, from the same design. Traders call the second outcome decay, and the fund’s own prospectus says it does not seek three times the index “for any period other than a day”. The first outcome is why people hold them for years. Both come out of one line of stochastic calculus, which this post follows in four steps: what a daily reset does to a fund, the variance tax it pays, the leverage that grows fastest, and the years in which three times the index beats three times its return. Then the real funds against the formula, and the one day the formula cannot see.
What a Daily Reset Does
A leveraged fund holds $L$ times the index each day and borrows the rest at the cash rate $r$; at the close it rebalances so that tomorrow it again holds $L$ times. If the index moves like a geometric Brownian motion, $dS/S = \mu\,dt + \sigma\,dB$, the fund’s value $V$ follows the first line below, and Itô’s lemma applied to both logarithms does the rest:
The last line is the whole story; Marco Avellaneda and Stanley Zhang wrote it down in this form in 2010, the year after Cheng and Madhavan showed that daily re-leveraging hides a path-dependent option that can destroy value for an investor who buys and holds. A leveraged fund is a power of the index, $L$ of them multiplied together, discounted by the borrowing and by a term in the variance. The route the index took does not appear, only where it ended and how much it shook on the way. In 1998 to 2009 the S&P 500 ended at 0.990, its volatility was 22.1% a year and bills paid 3.15%, and the formula gives 9.4 cents for three times leverage over the 11.2 years. Running the fund day by day gives 9.2.
The Variance Tax
The term $\tfrac12(L^2 – L)\sigma^2$ is the tax. It exists because a fund’s log growth loses half its own variance, and the fund’s variance is $L^2\sigma^2$, while $L$ copies of the index’s log growth only lose $L$ times half of $\sigma^2$. The difference is charged every year, rain or shine. At three times leverage it is $\textstyle 3\sigma^2$: 7.7% a year at the S&P 500’s 16.0% volatility since 1955, 12.8% at the 20.6% of QQQ since 2010, and 14.6% in the 22.1% of 1998 to 2009.
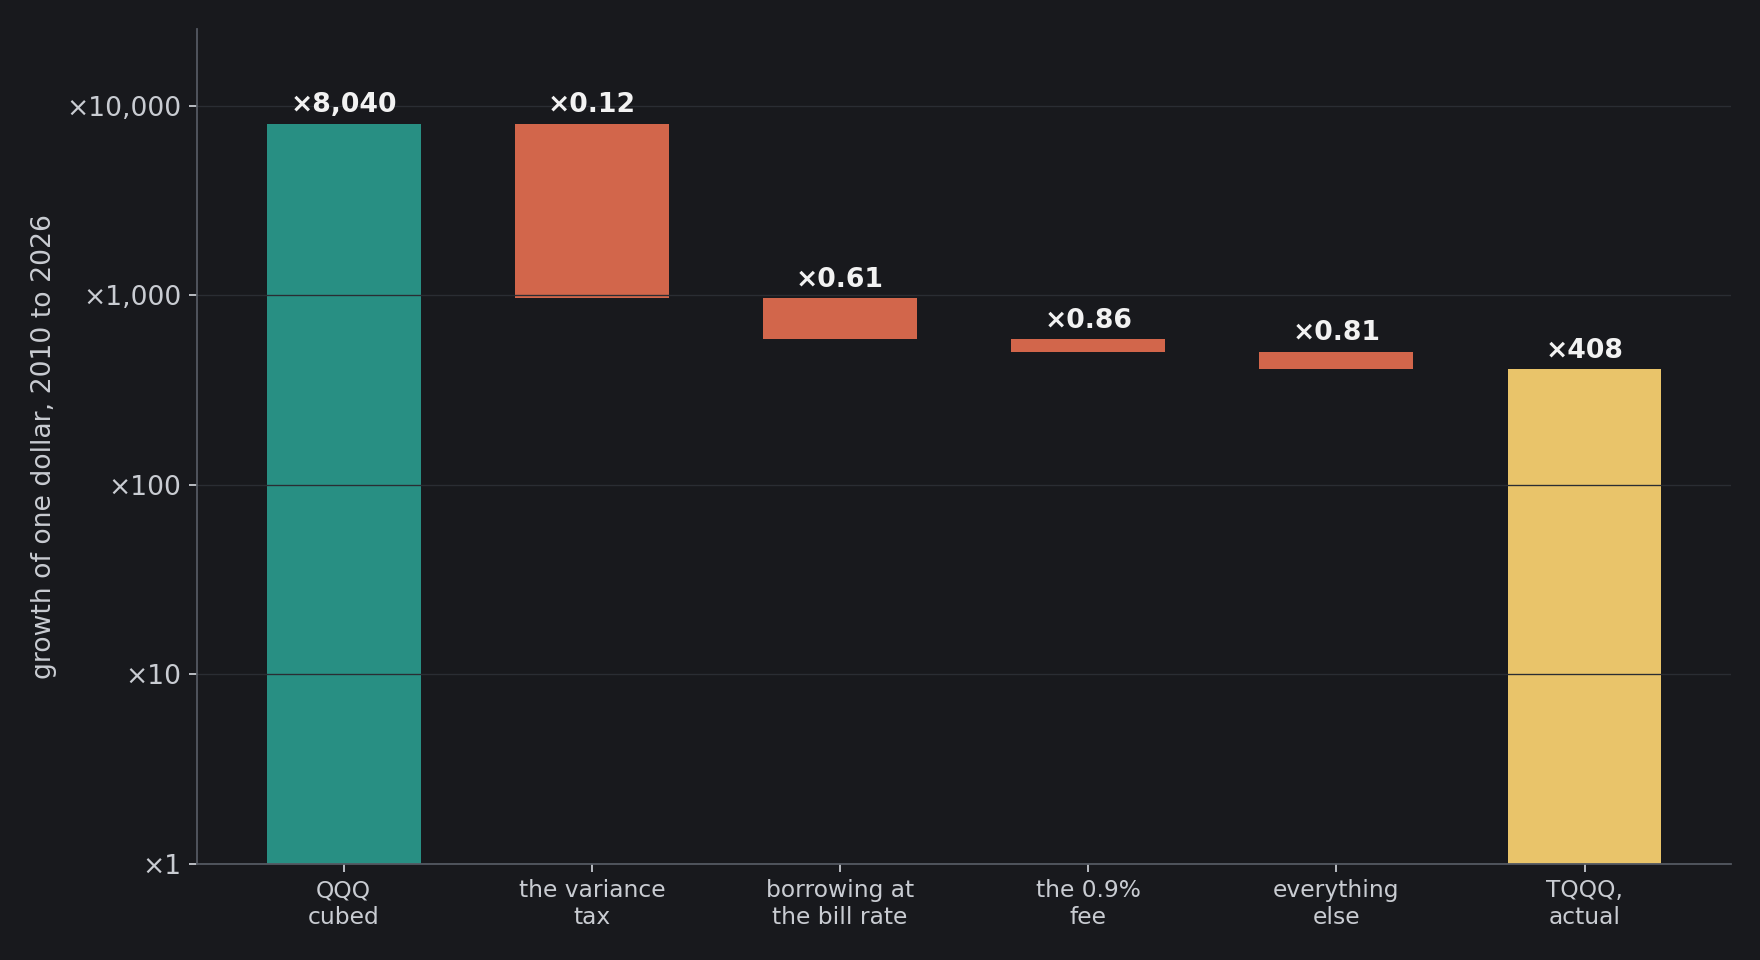
So TQQQ’s four hundred dollars was not free of the tax; it paid more of it than anyone. The cube of QQQ’s twentyfold gain is 8,040. The variance tax kept 12 cents of each of those dollars, borrowing at the bill rate kept 61 cents of what was left, the fee 86 cents and everything else 81 cents, and the fund ended at 408. The cube was there, and the tax took 88% of it.
The Leverage That Grows Fastest
Take the expected log growth of the fund instead of one path. It is a parabola in the leverage, and it has a top:
This is John Kelly’s betting rule of 1956 in continuous time, the share that Robert Merton’s portfolio rule of 1969 gives an investor with logarithmic utility, and the rule an earlier post used to size Medallion’s bets. Below $L^*$ more leverage means more growth; above it, more leverage means less, and at twice $L^*$ the growth is back to that of cash. The last line is the test that matters to a holder: three times out-grows the plain index exactly when the expected return beats the bill rate by more than twice the variance.
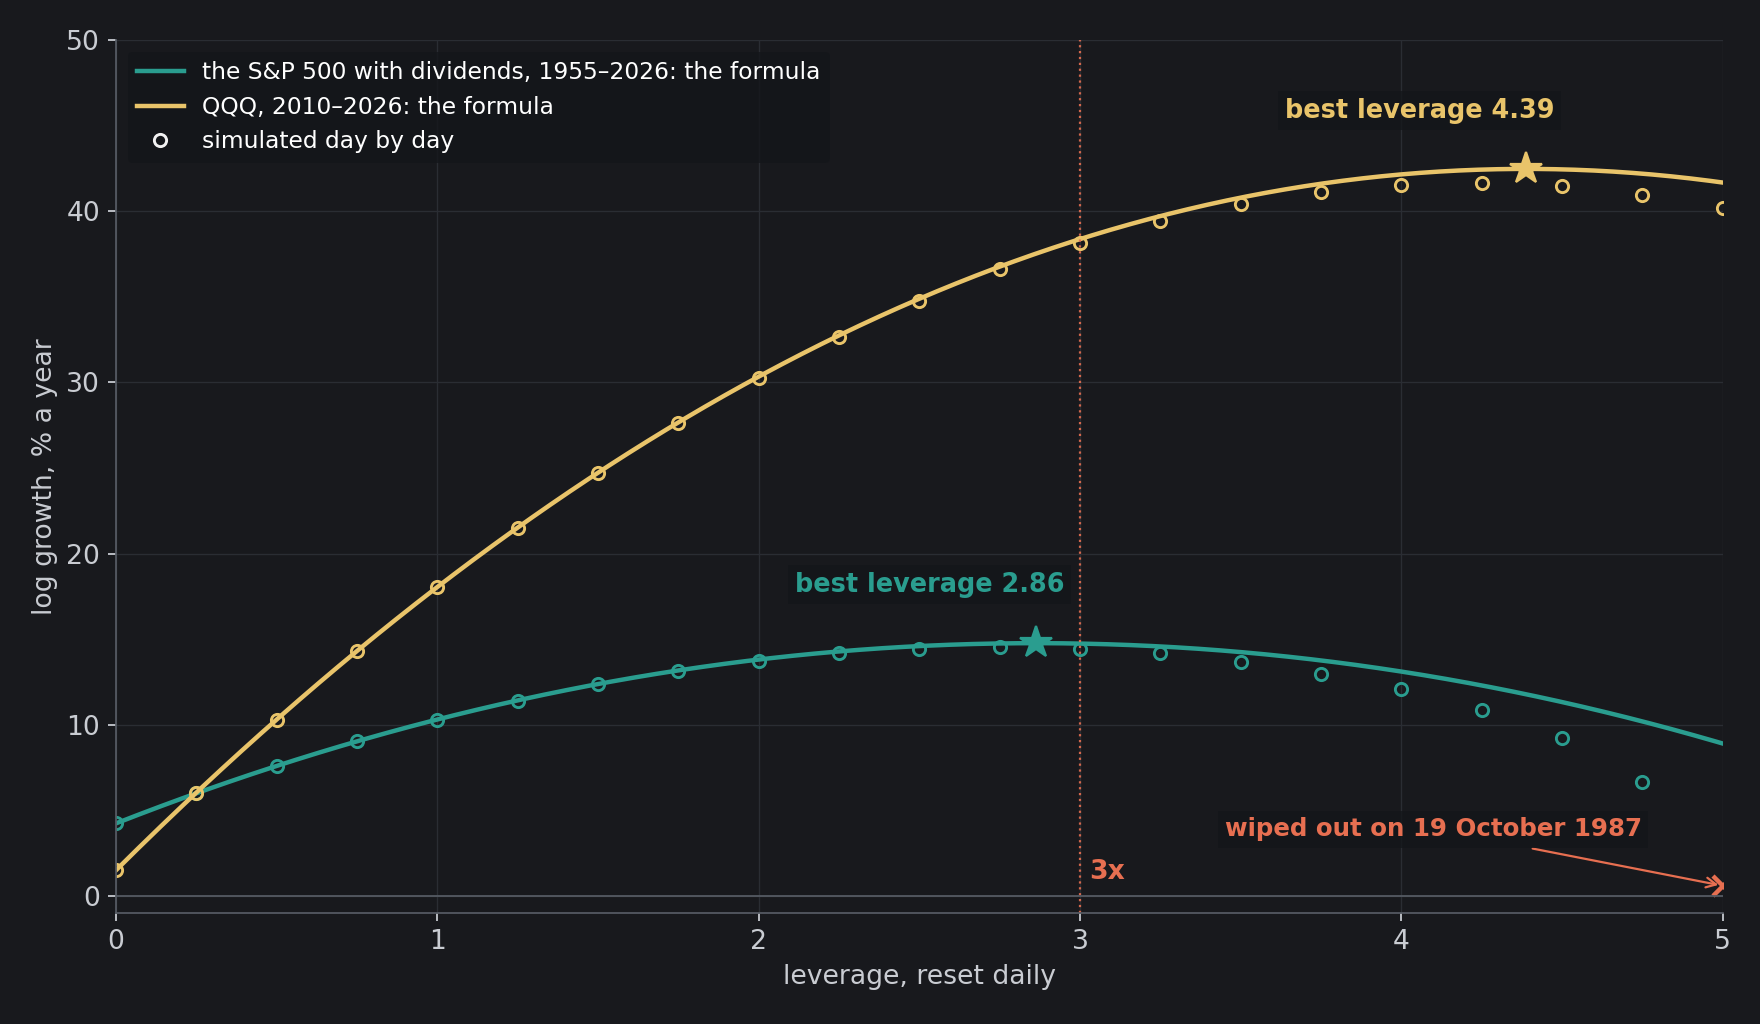
For the S&P 500 with dividends since 1955, the expected return was 11.6% a year, bills paid 4.2% and the volatility was 16.0%, so the best leverage was 2.86. Run day by day without costs, the index compounded at 10.9% a year, twice the index at 14.7% and three times at 15.5%; four times fell back to 12.8%. With the costs the real funds actually pay, about 2 points a year, three times the index still compounded at 13.2%, but its worst fall on the way was 98%. For QQQ from 2010 the expected return was 20.2%, bills paid 1.5% and the volatility was 20.6%: a best leverage of 4.39. TQQQ’s three times sat below the best leverage of its own era, which is why it grew. In the test’s terms, the S&P 500’s excess return of 7.35% a year beat twice its variance, 5.14%; QQQ’s 18.68% beat 8.51% by a mile; and over 1998 to 2009 the excess return was minus 0.80% against 9.74%, the best leverage was minus 0.17, and any leverage at all lost.
That is the catch. The best leverage is built from the expected return, and the expected return is the one quantity a price history barely reveals: as an earlier post measured, a share’s volatility can be read off a single day of prices, while its expected return needs about four hundred years of data to be known to within one point. Whether three times is too much is a question about the next decade’s drift, and no amount of past data answers it.
When Three Times Beats Three Times
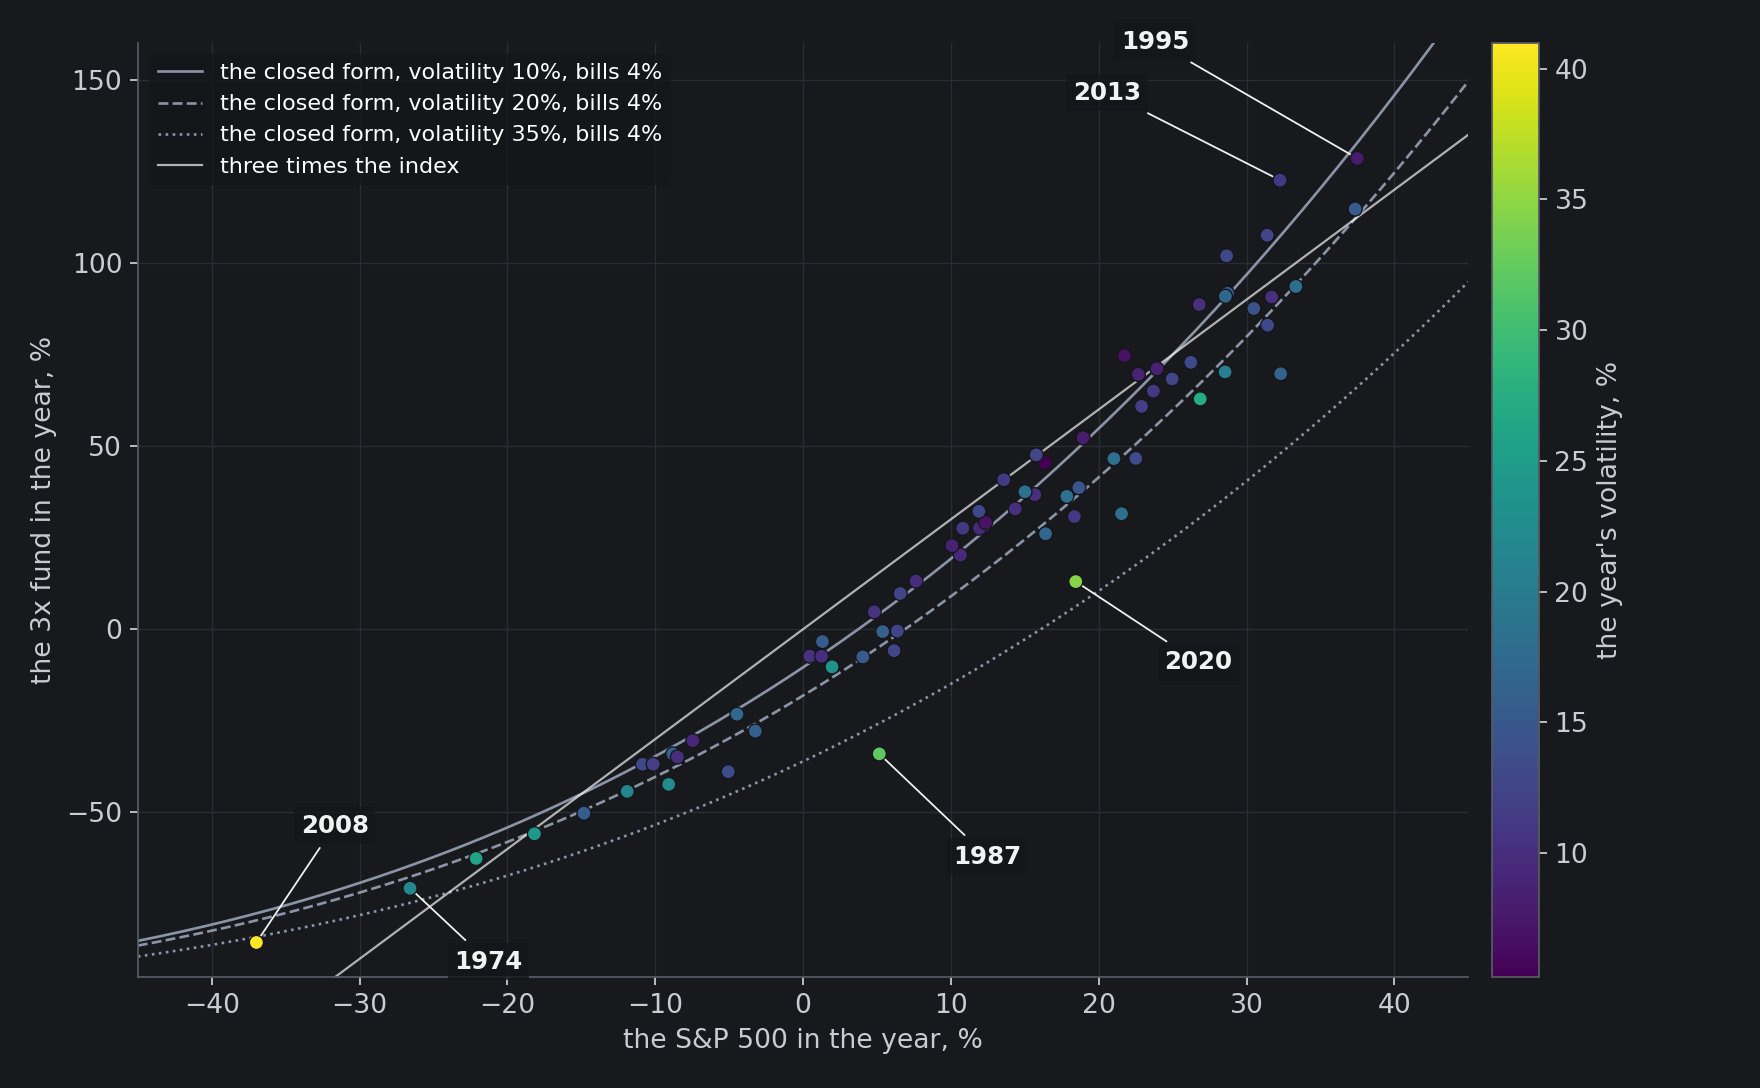
Over one year the same formula reads $V_1/V_0 = (1+R)^3\,e^{-3\sigma^2 – 2r}$, against the $\textstyle 1 + 3R$ that “three times” sounds like. The power rewards a trend and the exponential punishes the shaking, so in a calm, trending year the fund beats three times the index’s return, and in a choppy year it falls behind it.

It happened in 16 of the 71 years from 1955 to 2025. In 1958 the index rose 43.4% with a volatility of 9.0%, and the three-times fund rose 177.7%, where three times the index is 130.3%. In 2013 it was 32.3% against 122.6%, in 1995 37.5% against 128.5%. The trend helps on the way down too: in 2008 the index lost 37.0%, three times that would be more than everything, and the fund lost 85.5%. The chop is the other side. In 2020 the index rose 18.4% through a crash and a recovery, and the three-times fund rose only 13.0%, less than the index itself; the real UPRO rose 10% while SPY rose 18%. A leveraged fund is long the trend and short the chop.
The Real Funds
The formula is not only a model of the funds; it is close to the funds themselves. Rebuild TQQQ from QQQ’s daily total return, three times each day, borrowing at the bill rate and charging a 0.9% fee (TQQQ’s prospectus gives 0.78% today after a waiver, UPRO’s 0.88%), and it turns a dollar into 488 over the same years; the closed form gives 504; the real fund returned 408, about 1.1 points a year less than the rebuild. The funds get their leverage through swap agreements and futures, and the swaps charge a floating rate: at the end of May 2026 TQQQ was paying between 4.47% and 4.92% on them, while three-month bills paid 3.60%. UPRO against three times SPY is the same picture: 138 for the fund, 169 for the rebuild, 1.2 points a year apart.
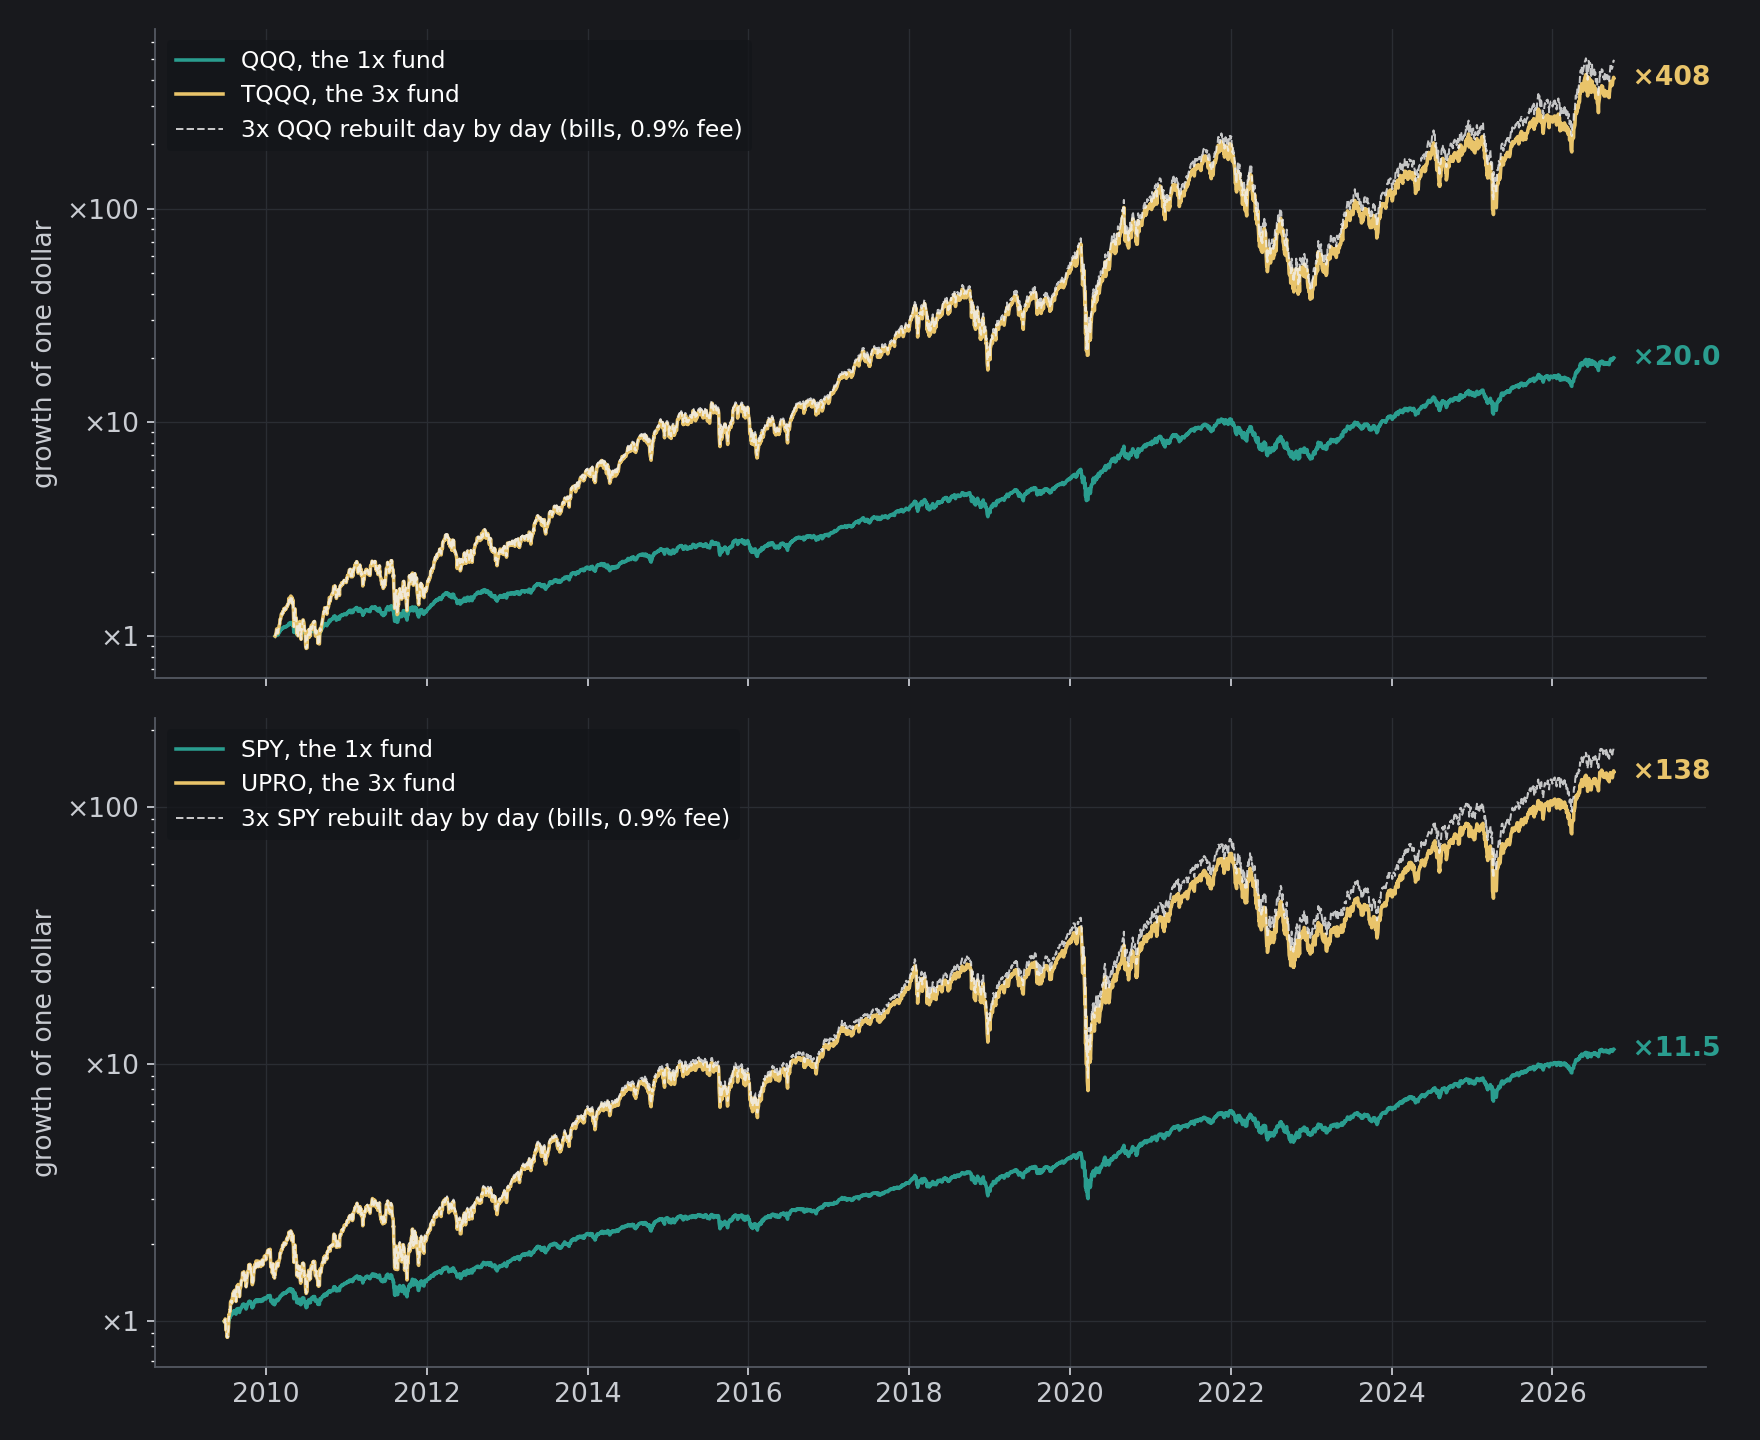
The years read like the scatter. In 2022 QQQ lost 33% and TQQQ 79%, where three times would have been 98%; in 2023 QQQ gained 55% and TQQQ 198%, well over three times. TQQQ’s worst fall from a peak was 81.7%, QQQ’s 35.1%.
The Day the Formula Cannot See
The formula assumes the index moves continuously, and on 19 October 1987 it did not: the S&P 500 fell 20.5% in a single session. A fund holding three times it lost 61% that day, four times lost 82%, and five times lost 102%, more than everything, so a five-times fund on the S&P 500 would have ended there and then, whatever came after. The prospectus puts the same arithmetic plainly for TQQQ: if the index approaches a 33% loss in a day, “you could lose your entire investment.” In the year 1987 the closed form says the three-times fund lost 24%; run day by day it lost 34%. Over the 71 years the formula is within a tenth of a point of the day-by-day result in a typical year, but it overstates four times leverage’s growth by about one point a year, because of days like that one.
Try It
The board is a time machine. Choose the S&P 500 with dividends since 1955 or QQQ since 1999, any window, any leverage and any yearly cost, and read the index’s multiple, the fund’s, what “L times” sounds like, the closed form’s prediction, the variance tax and the window’s best leverage. I read its cards back in a browser at nine settings against Python, and checked the post’s own numbers against the board: all agree.
Algorithm — Running a Leveraged Fund Through History
input:  daily index levels S_t with dividends, daily bill rate r_t,
        leverage L, yearly costs c
each day t:
    R_t ← S_t / S_(t−1) − 1
    V_t ← V_(t−1) · (1 + L R_t − (L − 1) r_t / 252 − c / 252)
    if V_t ≤ 0: the fund is wiped out
the closed form over [0, T]:
    σ² ← 252 · variance of R_t;  ∫r ← Σ r_t / 252
    V_T / V_0 ← (S_T / S_0)^L · exp(−(L² − L) σ² T / 2 − (L − 1) ∫r − c T)
the best leverage:  L* ← (μ − r) / σ²,  μ ← 252 · mean of R_t
check: the closed form against the day-by-day fund: 1998–2009, 9.4 cents
    against 9.2; the median year within 0.05 points; 1987 off by 10
check: TQQQ and UPRO against their rebuilds from QQQ and SPY
check: the growth formula against 21 leverages run day by day since 1955
For a Day, or for Years
Leveraged funds arrived in June 2006, when ProShares launched its first funds at twice the index, and three-times funds followed in November 2008, in the middle of the crash. By the summer of 2009 the regulators were warning. FINRA told brokers in June that leveraged funds reset daily “typically are unsuitable for retail investors who plan to hold them for longer than one trading session, particularly in volatile markets”, and the SEC and FINRA told investors that their performance “over a period longer than one day can differ significantly from their stated daily performance objectives”. TQQQ’s prospectus still says it in two sentences: “The volatility of the Index has a negative impact on Fund returns”, and the fund does not seek three times the index for any period other than a day.
Every one of those sentences is true, and the years after them were the best a three-times fund could have had. The formula is what reconciles them. Marco Avellaneda, a mathematician on the faculty of NYU’s Courant Institute for almost forty years, put its meaning in one line: the holder of a leveraged fund “has negative exposure to the realized variance of the underlying asset. This holds regardless of the sign” of the leverage. A three-times fund is a bet that over the years you hold it, the market’s excess return will beat twice its variance. The variance can be seen within days; the excess return, as the earlier post found, takes centuries. Avellaneda died on 11 June 2022, at 67. That year TQQQ lost 79%, and the next it gained 198%, both just as his formula says a three-times fund can.
Sources
- ProShares UltraPro QQQ (TQQQ), Summary Prospectus, 28 September 2026: the objective, the fees and the risks quoted; its inception, 9 February 2010, from proshares.com.
- M. Avellaneda and S. Zhang, “Path-dependence of leveraged ETF returns”, SIAM Journal on Financial Mathematics 1 (2010) 586–603.
- M. Cheng and A. Madhavan, “The dynamics of leveraged and inverse exchange-traded funds”, Journal of Investment Management 7 (4) (2009).
- J. L. Kelly Jr., “A new interpretation of information rate”, Bell System Technical Journal 35 (1956) 917–926.
- R. C. Merton, “Lifetime portfolio selection under uncertainty: the continuous-time case”, The Review of Economics and Statistics 51 (1969) 247–257.
- ProShares UltraPro S&P500 (UPRO), Summary Prospectus, 28 September 2026: the objective and the fees.
- The funds’ swap financing rates at 31 May 2026: ProShares Trust, annual report for the year ended 31 May 2026, filed with the SEC.
- The first leveraged ETFs: ProShares Ultra QQQ (QLD), inception 19 June 2006, from proshares.com; Direxion’s three-times funds, inception 5 and 6 November 2008, from direxion.com.
- FINRA, Regulatory Notice 09-31, “Non-Traditional ETFs”, June 2009.
- SEC and FINRA, Investor Alert, “Leveraged and Inverse ETFs: Specialized Products with Extra Risks for Buy-and-Hold Investors”, 2009.
- Marco Avellaneda, 1955–2022: New York University, Courant Institute, notice of his death; the date from the editors’ note in Revista Mexicana de Economía y Finanzas.
- The data: daily closes of the S&P 500 (Kaggle, paveljurke, CC0, from Yahoo Finance); R. J. Shiller’s monthly dividends (shillerdata.com); the 3-month Treasury bill rate, FRED series DTB3 (Board of Governors of the Federal Reserve System, H.15); daily adjusted closes of TQQQ, QQQ, UPRO and SPY from Yahoo Finance.
Every number in the text, the charts and the board are computed by the scripts archived with this post from the S&P 500’s daily closes since 1955 with Robert Shiller’s dividends, the 3-month Treasury bill rate (FRED DTB3) and the daily adjusted closes of TQQQ, QQQ, UPRO and SPY.
Interested in applying these ideas to your work? Get in touch.