
Right 50.75% of the Time
Barely Right, Very Often
Between 1988 and 2018, the Medallion fund of Jim Simons’ Renaissance Technologies made an average of 66% a year before fees, and 39% after them. For scale, money compounding at 66% a year for thirty years multiplies about four million times. Robert Mercer, a former co-chief executive of the firm, reportedly explained it to a friend in a strange way: “We’re right 50.75 percent of the time … but we’re 100 percent right 50.75 percent of the time. You can make billions that way.”
Right three times in four would sound like a secret. Right 50.75% of the time sounds like barely knowing anything, until you add the other number in the same book: Medallion placed 150,000 to 300,000 trades a day. One bet at 50.75% is worth almost nothing on its own; its Sharpe ratio is 0.015. Three hundred thousand of them make about 4,500 units of profit a day on average, while the luck in a day’s result, if the trades are independent, is about 548 units. The profit sits eight standard deviations above zero. That is how a tiny edge becomes a fortune, and the arithmetic says exactly what it needs: at least 4,505 independent bets a year for 66%, about 18 a day, and bets that barely move together. If any two of them move together by more than 1 in 4,504, no number of bets and no amount of leverage gets you there. Medallion’s own numbers put it far past that wall.

This post runs Medallion’s numbers through four steps: what one bet is worth, what many bets add up to, how much to stake on each, and what that stake costs. The last step holds the surprise. The chance of losing half your money is set by a single dial, and the size of your edge is not it.
One Bet Is Almost Nothing
A win rate on its own can mean nothing: set the target close and the stop far away, as an earlier post showed, and a fair game is won nine times in ten. So take the plainest bet there is, one that wins a unit with probability $p$ and loses a unit otherwise. Here the win rate is the edge. Its mean, its variance and its Sharpe ratio, the mean earned per unit of risk, are
At $p = 0.5075$ the mean is 0.015 of a unit and the Sharpe ratio is 0.0150. That is how faint the signal is. After $n$ such bets the edge stands out from luck by $s_1\sqrt{n}$ standard errors, so seeing it at two standard errors takes $n = (2/s_1)^2 = 17{,}774$ bets. A trader placing ten bets a day would need about seven years just to know the edge was real.
Many Bets, and the Wall
Medallion did not place ten bets a day; it placed 150,000 to 300,000. Add up $N$ bets in a year and let any two of them be correlated by $\rho$. The variance of the sum is $Nv\,\big(1 + (N-1)\rho\big)$, so the Sharpe ratio of the whole book is
When the bets are independent, $\rho = 0$, the Sharpe ratio grows with the square root of their number, without limit. Richard Grinold wrote this down in 1989 as the fundamental law of active management: skill per bet times the square root of breadth, where breadth counts independent bets, not trades. At 50.75%, 17,774 independent bets a year make a Sharpe ratio of 2: the same count that it took to tell the edge from luck.
When the bets are correlated, there is a wall. The Sharpe ratio climbs, then flattens at $s_1/\sqrt{\rho}$, however many bets are added. With a correlation of 1 in 1,000 between any two bets the ceiling is 0.47. With 1 in 10,000 it is 1.50, and with 1 in 100,000 it is 4.74.
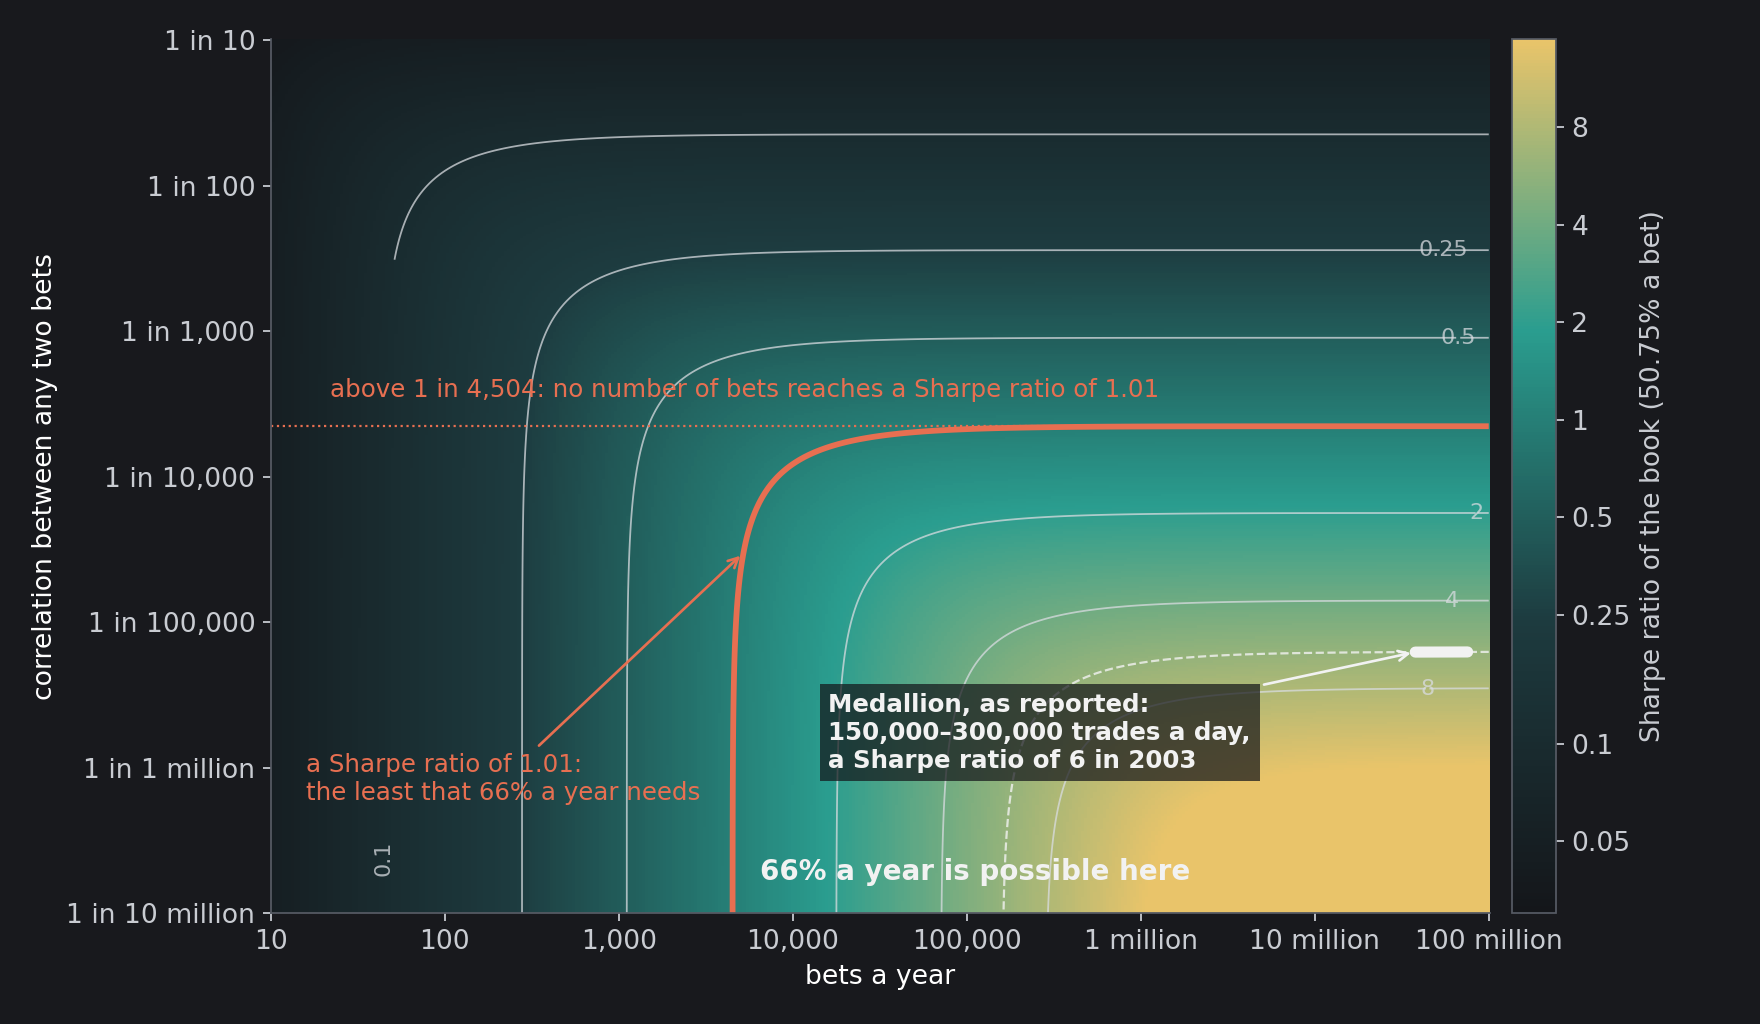
The same arithmetic applies to anyone who trades. Take a trader who is right 55% of the time and places two trades a week, 104 a year. If the trades are independent, the book’s Sharpe ratio is 1.02, and 3.8 years of results would prove the skill at two standard errors. If the trades are correlated by 0.2, say because they are all long positions in the same market, the Sharpe ratio is 0.22, under a ceiling of 0.225 that no number of trades can pass, and proving the same skill would take 82 years.
I checked the formula against 400,000 simulated years of correlated bets. At 50.75% the simulation gives 1.006 for 4,504 independent bets (the formula says 1.007) and 0.464 for 20,000 bets correlated 1 in 1,000 (0.463); for the 55% trader with correlation 0.2 it gives 0.218 (0.221).
How Much to Stake
An edge earns nothing until money is put on it, and the question of how much was answered by John Kelly at Bell Labs in 1956: stake whatever makes the logarithm of wealth grow fastest, because over many rounds that is what decides where the money ends up. Robert Merton solved the same problem for a market that trades continuously in 1969. With a stake $f_i$ on bet $i$, the growth rate of log wealth is, to second order,
The inverse in the middle line is the Sherman–Morrison formula, which inverts the identity plus one outer product in a single step. The last line says three things. Independent bets each get 1.5% of capital, the Kelly stake $m = 2p – 1$ of a gambler at 50.75%. Correlated bets get less, divided by $\big(1 + (N-1)\rho\big)$. And the fastest growth any staking can reach is half the square of the book’s Sharpe ratio.
The stakes agree with a direct numerical solve of $\Sigma f = \mu$ to six significant figures in three books (40 bets correlated 0.02, 500 at 1 in 1,000, 2,000 at 1 in 10,000), and the exact expected growth of 4,504 bets in a row at the Kelly stake is 0.5067 a year, against 0.5068 from the formula.
Running 66% Backwards
Now the number can be run backwards. Suppose money compounds at 66% a year, Medallion’s reported average. That is a growth rate of $\ln 1.66 = 0.507$ in log wealth, and since no staking grows faster than $\tfrac12 S^2$,
A Sharpe ratio of 1.007 is the least that 66% a year needs, at any leverage. If 3 points of the 66% were interest on cash, the bar is 0.977. If the reported 66% is an average of yearly returns rather than a compounded rate, the bar is a little lower again, but the shape of the answer does not change.
The single number $k$ does two jobs. It is the fewest independent bets that can do it: 4,505 a year. And one over it is the most correlation that leaves 66% possible at all. With a correlation of 1 in 100,000 between any two bets it takes 4,717 bets a year; with 1 in 10,000 it takes 8,195; with 1 in 5,000 it takes 45,398. From 1 in 4,504 on, it cannot be done.
Medallion’s Own Numbers
Now put in what the book reports: 150,000 to 300,000 trades a day, or 38 to 76 million a year. If every one of them were independent, the formula above would give the fund a Sharpe ratio of 92 to 130. The book reports a Sharpe ratio of 6.0 for 2003. Run backwards through the same formula, a Sharpe ratio of 6 from that many trades means they behaved like about 160,000 independent bets a year, 635 a day, with a correlation of about 1 in 160,000 between any two of them. That fits the book’s account that much of the trading was one position bought or sold in small pieces, so as not to move the price: pieces of one bet are not separate bets.
And 160,000 independent bets a year is 35 times the 4,505 that 66% needs. So the tiny edge was never the obstacle. Medallion met both conditions: far more bets than the edge required, and bets that had almost nothing to do with each other: not the same market move, not the same news, not the same crowded trade. That is how I would read Mercer’s sentence. Its actual bets, correlations and leverage are not public; the trade count, the Sharpe ratio for 2003 and the 50.75% itself are what the book reports, and the rest is the arithmetic.
The Price of Leverage

The stake that grows fastest is not the stake anyone should want. Bet a fraction $c$ of the Kelly stakes. Log wealth then moves as a Brownian motion with a drift and a volatility,
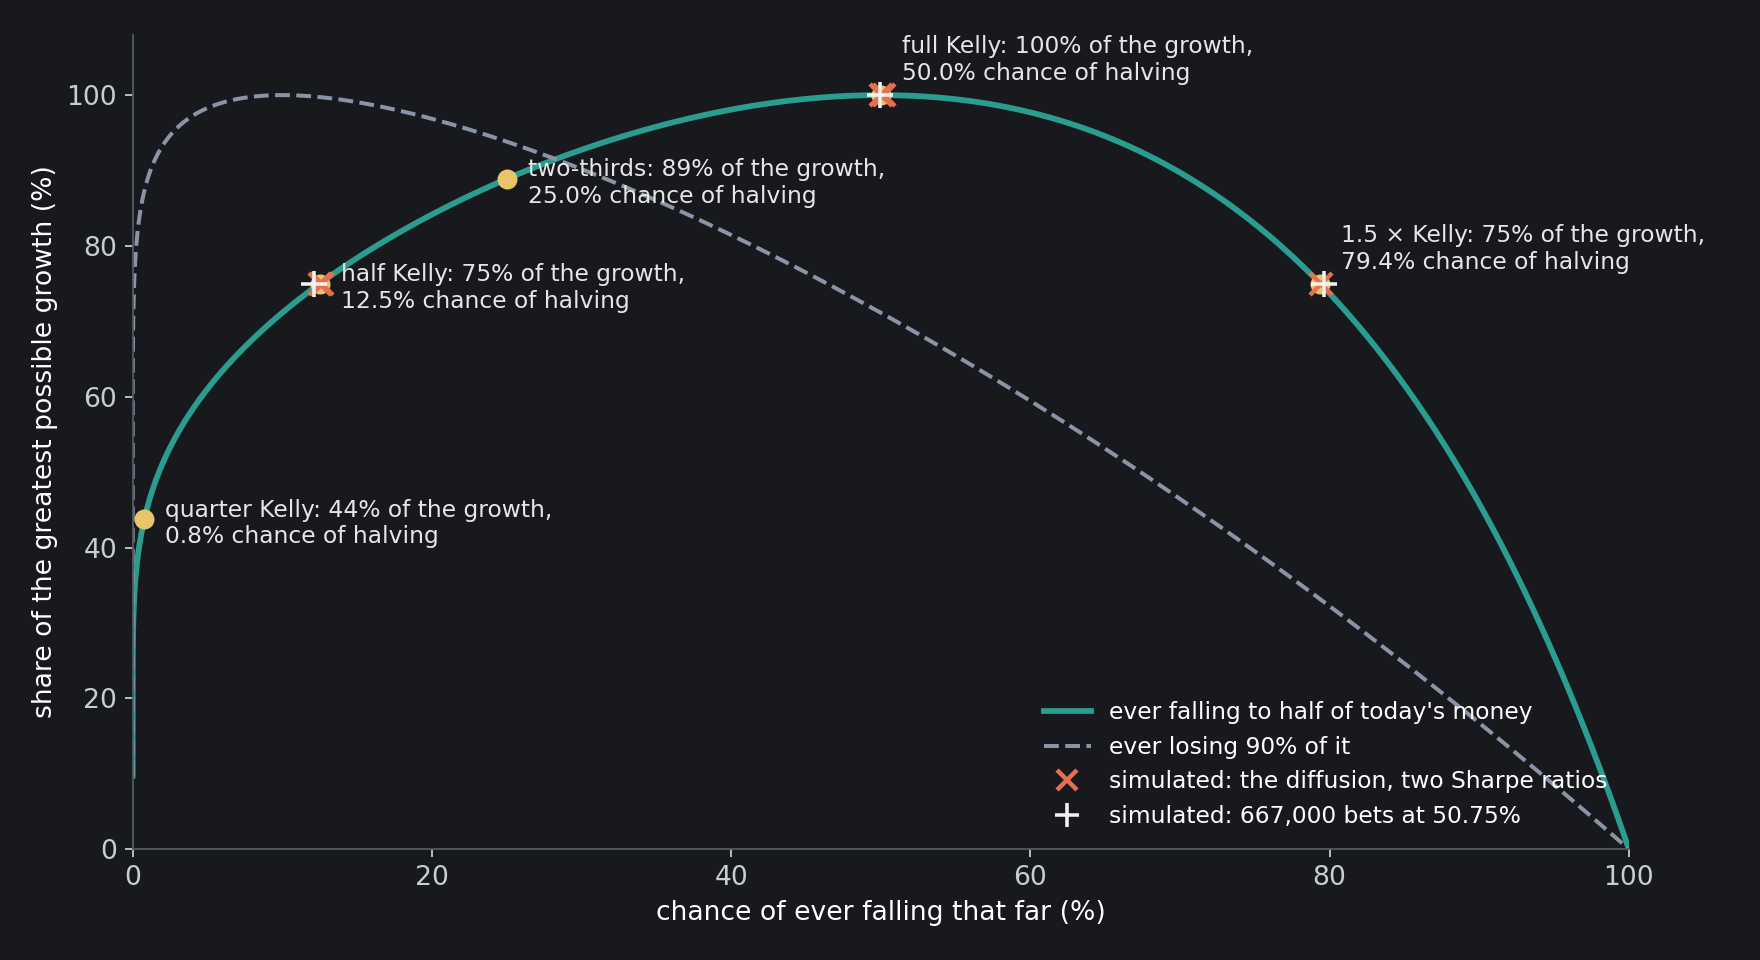
and the second line is the classical chance that a drifting Brownian motion ever falls a distance $\ln(1/x)$, worked out for this purpose by Edward Thorp in 2006, after Don Schlesinger. Look at what is missing from it: the Sharpe ratio. In the exponent, the $S^2$ of the drift cancels the $S^2$ of the variance. A better edge makes the money grow faster, but it does not change the chance of watching half of it disappear on the way. Only the fraction of Kelly does.
At full Kelly that chance is 50%, and the chance of ever losing 90% is 10%. At half Kelly the chance of halving falls to 12.5% and of losing 90% to 0.1%, while the growth rate keeps 75% of its maximum. At one and a half times Kelly the growth is the same as at half Kelly, but the chance of halving is 79.4%. At twice Kelly the growth is zero, and every level below is reached sooner or later. Thorp’s other number makes the trade plain: at full Kelly the money doubles before it halves two times in three; at half Kelly, eight times in nine.
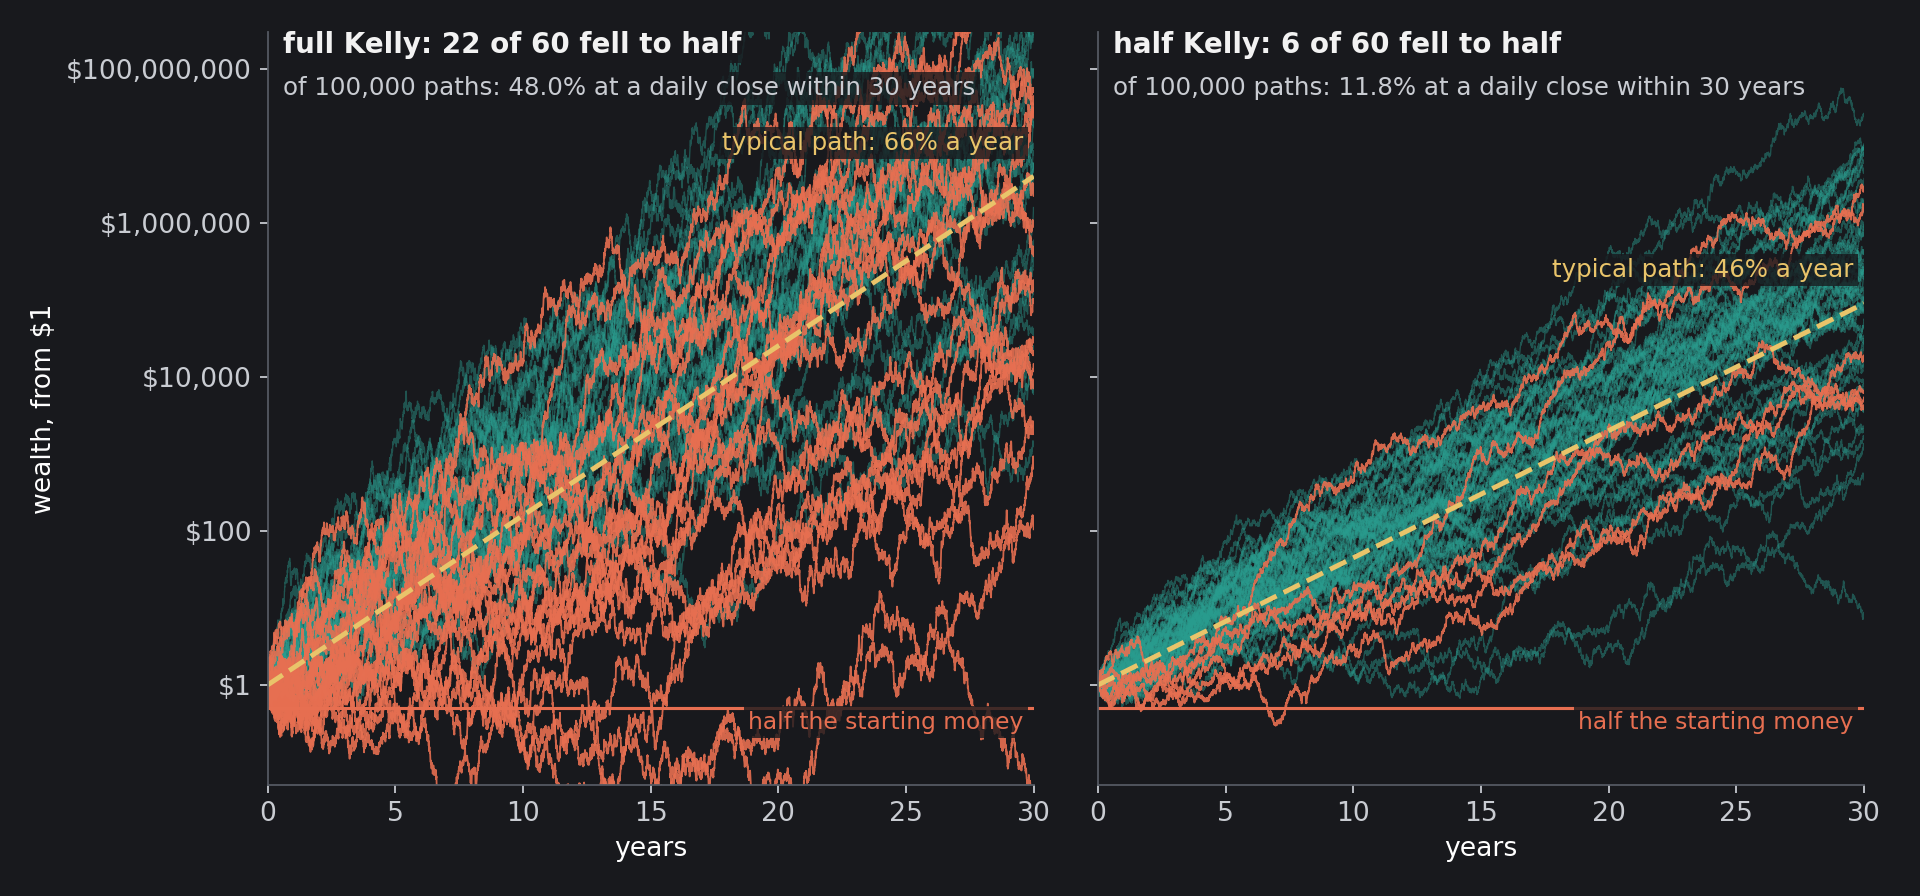
I checked the formula two ways that never use it. Simulated in continuous time, 40,000 fortunes with a Brownian-bridge test for a fall between steps ever halved 0.500 and 0.502 of the time at full Kelly, with Sharpe ratios of 1.007 and 2; 0.125 and 0.127 at half Kelly; and 0.794 at one and a half times Kelly, where the formula says 0.794. And 24,000 gamblers placing 667,000 bets each at 50.75%, staking 1.5% of their money on every bet at full Kelly, half that, and one and a half times that, halved 0.499, 0.121 and 0.796 of the time.
Try It
The board computes everything in your browser from the formulas above. Set the hit rate, the number of bets a year, the correlation between them and the fraction of Kelly, and read the Sharpe ratio of the book, its ceiling, the stake on each bet, the growth, the chance of halving, and the years of record it takes to prove the edge. I read its cards back in a browser at eight settings and compared each with Python’s numbers; all eight matched.
Algorithm — Running a Hit Rate Backwards to a Fund
input:  hit rate p, bets a year N, correlation ρ, fraction of Kelly c
m ← 2p − 1;  v ← 1 − m²;  s₁ ← m / √v
S ← s₁ √(N / (1 + (N − 1) ρ));  ceiling ← s₁ / √ρ
stake on each bet ← c · m / (v (1 + (N − 1) ρ))
growth a year ← S² (c − c²/2)
P(ever halving) ← (1/2)^(2/c − 1);  P(ever losing 90%) ← (1/10)^(2/c − 1)
years of record to prove the edge ← (2 / S)²
a target growth G:  S_min ← √(2G);  k ← (S_min / s₁)²
    bets a year needed ← k (1 − ρ) / (1 − k ρ), possible only while ρ < 1/k
check: 400,000 simulated years of correlated bets (beta-binomial)
check: the stakes against a direct solve of Σ f = μ
check: 40,000 fortunes in continuous time, Brownian-bridge test;
    24,000 gamblers of 667,000 bets each at 50.75%
What 50.75% Means
Mercer’s line is usually quoted as proof that a tiny edge is enough, and the arithmetic agrees, on two conditions. The edge has to be placed a very large number of times on bets that have almost nothing to do with each other: that is how a Sharpe ratio of 0.015 a bet became one of 6. And the stake on each has to be a fraction of what the formula allows. The first is a question of how many truly separate bets you have, which is not the same as how many trades you place. The second has an answer that does not depend on how good you are: at full Kelly, the chance of seeing half your money gone at some point is one in two.
Thorp, who counted cards at blackjack before he ran money, put the second point in human terms. In his experience and in the reports of blackjack players and teams, he wrote, most people “strongly prefer the increased safety and psychological comfort of ‘half Kelly’ (or some nearby value), in exchange for giving up 1/4 of their growth rate.”
Sources
- G. Zuckerman, The Man Who Solved the Market: How Jim Simons Launched the Quant Revolution, Portfolio/Penguin (2019): Medallion’s returns from 1988 to 2018, and Robert Mercer’s remark.
- R. C. Grinold, “The fundamental law of active management”, The Journal of Portfolio Management 15 (1989) 30–37.
- J. L. Kelly Jr., “A new interpretation of information rate”, Bell System Technical Journal 35 (1956) 917–926.
- R. C. Merton, “Lifetime portfolio selection under uncertainty: the continuous-time case”, The Review of Economics and Statistics 51 (1969) 247–257.
- J. Sherman and W. J. Morrison, “Adjustment of an inverse matrix corresponding to a change in one element of a given matrix”, The Annals of Mathematical Statistics 21 (1950) 124–127.
- E. O. Thorp, “The Kelly criterion in blackjack, sports betting, and the stock market”, in S. A. Zenios and W. T. Ziemba (eds.), Handbook of Asset and Liability Management, Vol. 1, Elsevier (2006) 385–428, §7.3–7.4.
Every number in the text, the charts and the board are computed by the scripts archived with this post: the closed forms, checked against 400,000 simulated years of correlated bets, a direct solve of the Kelly problem, the exact growth of 4,504 bets in a row, 40,000 fortunes simulated in continuous time and 24,000 gamblers placing 667,000 bets each.
Interested in applying these ideas to your work? Get in touch.