The Forest That Burns All at Once
Summerland, Friday Evening
On the evening of Friday 7 August, a fire was reported on Bald Range, in the hills west of Summerland in the Okanagan. It ran about 15 kilometres toward the town at what reporters called extraordinary speed. By Saturday it covered 9,500 hectares. The whole of Summerland, about 12,000 people, was ordered out, along with some 8,000 around Peachland across the lake, and British Columbia declared a state of emergency. More than 100 wildfires were burning across the province, under a record-setting heat dome that came after a long drought.
On news like this the first number is always a count: a hundred fires, then a hundred and fifty. It is the wrong number to watch. Over the last forty seasons in British Columbia, the number of fires has told you almost nothing about how much forest a season would burn.
Forty Seasons
The BC Wildfire Service has recorded every wildfire it attended, and the National Fire Database keeps the list: 77,316 fires from 1986 to 2025, each with a point of origin, a date and a final size.
The season with the most fires was 1994: 4,057 of them. Together they burned 29,755 hectares, and the largest, a human-caused fire that started on 20 July a few kilometres from Penticton, at the south end of Okanagan Lake, burned 5,498. The season with the most area was 2023: 2,280 fires, little more than half as many, burned 2,840,247 hectares, ninety-five times as much. Across the forty seasons the number of fires varies by a factor of six, and the area burned by a factor of 957.
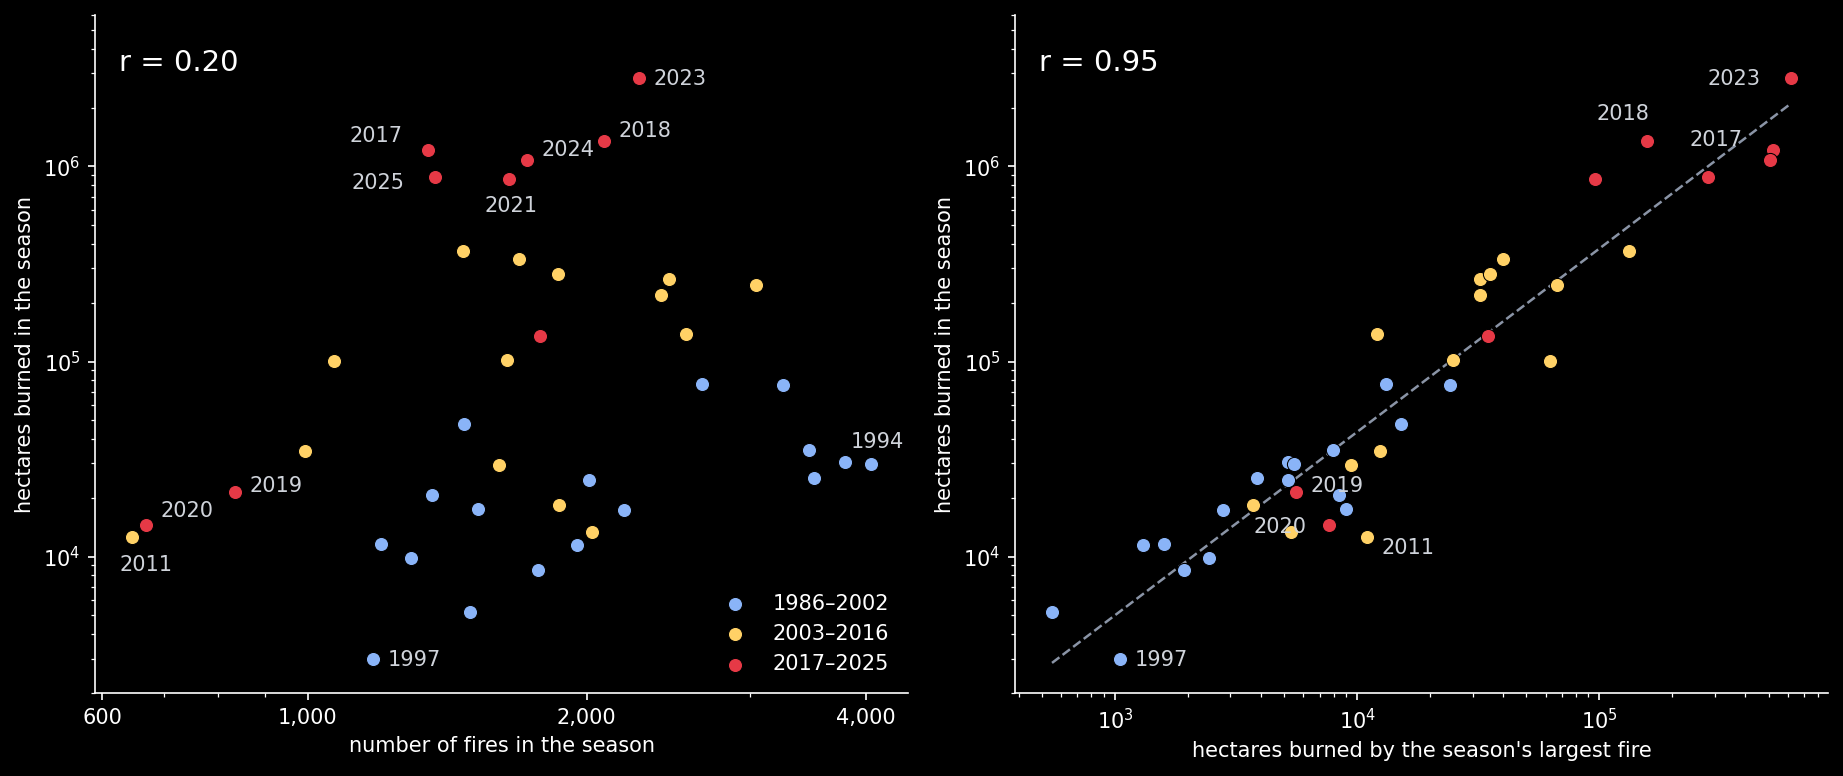
On a logarithmic scale, the correlation between a season’s number of fires and its area burned is 0.20: the count explains 4% of the variation. Replace the count with the size of the season’s single largest fire and the correlation is 0.95. Part of that is arithmetic, since the largest fire is part of the total. But in a typical season it is only a quarter of the total, and the other three quarters rise and fall with it.
The reason is how unequal fires are. The typical BC fire is tiny: half of them are put out, or go out, at a tenth of a hectare or less, and 80% never reach one hectare. The 1,648 fires that grew past 200 hectares, 2.1% of the total, burned 97.8% of all the area. For the whole of Canada from 1959 to 1997, Brian Stocks and his colleagues found almost exactly the same split: 3.1% of fires, 97% of the area. In a typical BC season, the largest 1% of fires burn 83% of what burns.
The Map
Here are all 77,316, season by season. Fires of 10 hectares or more are circles whose area is the area they burned, drawn to the scale of the map. Every smaller fire is a dot.
Put 1994 next to 2023. In 1994 the map is covered in dots: thousands of fires, spread evenly over the populated south, and hardly a circle big enough to see. In 2023 there are fewer dots, and a handful of teal circles in the northeast, each tens of kilometres across, carry most of the season. The largest of them, Donnie Creek, started on 12 May between Fort St. John and Fort Nelson, and burned 619,073 hectares, 22% of the whole season, on its own. Then switch off “people” under cause: most of the dots stay, since 57% of all fires were started by lightning, and nearly every large circle stays too. Lightning fires burned 87% of the area.
The stop after 2025 is this summer, so far: every fire the BC Wildfire Service lists as started by 18 August, drawn at its latest reported size. Those sizes are not final, so 2026 has a dashed bar and stays out of every statistic in this post. Its large circles sit in the south, around Lillooet, and one red circle in the hills west of Summerland is Bald Range.
Fewer Fires, Thirty-Five Times the Area
Split the forty seasons into three eras and the trend runs against intuition.
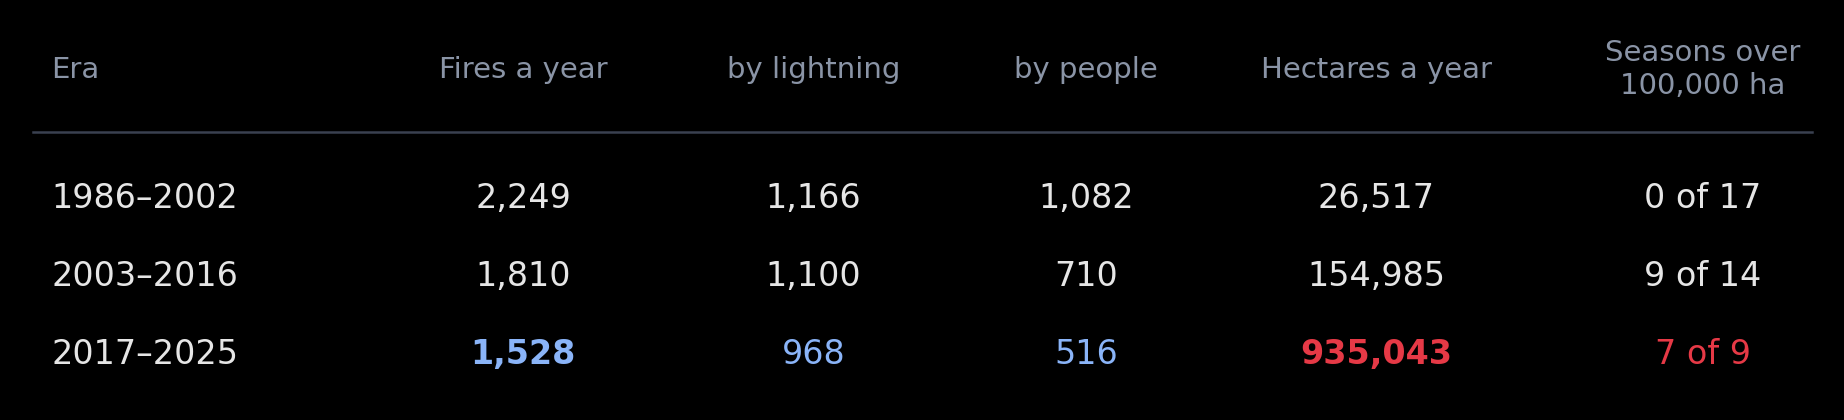
Fire prevention has worked. Human-caused fires fell by more than half, from 1,082 a year to 516, and the total fell by a third. The area burned went up thirty-five-fold. Six of the last nine seasons burned more than half a million hectares; not one of the seventeen seasons before 2003 burned even a hundred thousand.
The shape of the distribution changed too. For fires of 10 hectares and more, the share of fires larger than a size $s$ falls roughly like a power of $s$:
and the exponent $\alpha$ can be estimated by maximum likelihood from the $n$ fires above the cutoff $s_{\min}$ of 10 hectares:
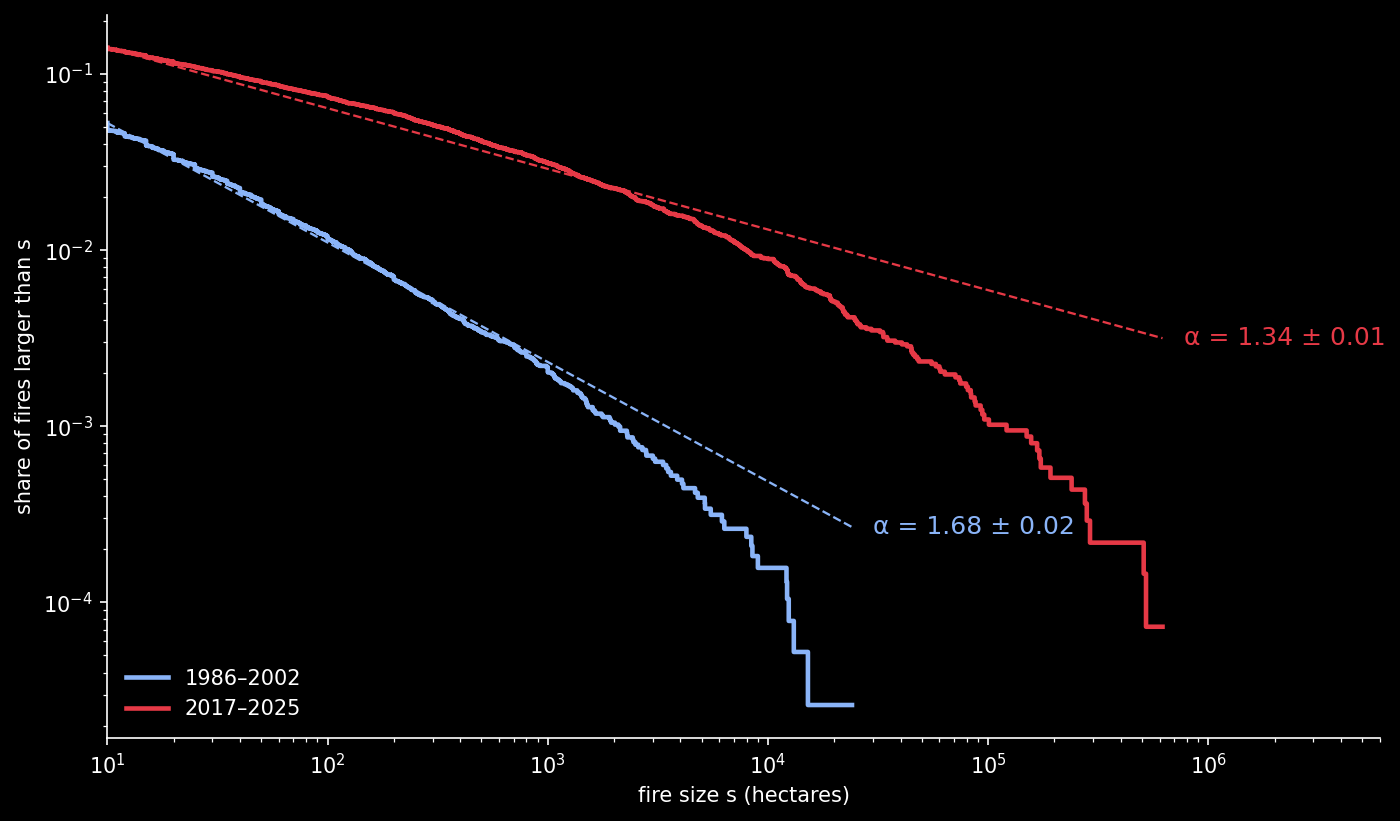
In 1986–2002 the estimate is 1.68, with a standard error of 0.02; in 2017–2025 it is 1.34, with an error of 0.01. An exponent below 2 is a strong statement. For such a tail the average fire size does not settle down as fires accumulate: every new record fire drags it up again, and the total of a season is of the same order as its largest fire. That is Figure 2 in one line. An exponent falling toward 1 means the largest fire takes an ever larger share. Bruce Malamud, Gleb Morein and Donald Turcotte found power laws of this kind in fire records from the United States and Australia in 1998, and linked them to a simple model of a forest that sits permanently at a tipping point. To see why a forest should have a tipping point at all, go back to 1957 and a gas mask.
A Forest Is a Lattice
Simon Broadbent was designing gas masks for coal miners, and wanted to know how gas finds its way through the random maze of pores inside a carbon granule. He took the question to the mathematician John Hammersley, and together they founded percolation theory.
Take a square grid and fill each square independently: with fuel with probability $p$, empty otherwise. Light one edge, and let fire pass only between squares that share a side. When $p$ is small the fuel sits in small, separate clusters, and the fire dies within a few squares. When $p$ is large one cluster spans the whole grid, and the fire crosses it. In between there is no gentle slope: on an unlimited grid the switch happens at one exact value, $p_c$, which on the square grid is 0.592746 to six digits. At 55% the fire always stays local; at 65% it almost always crosses.
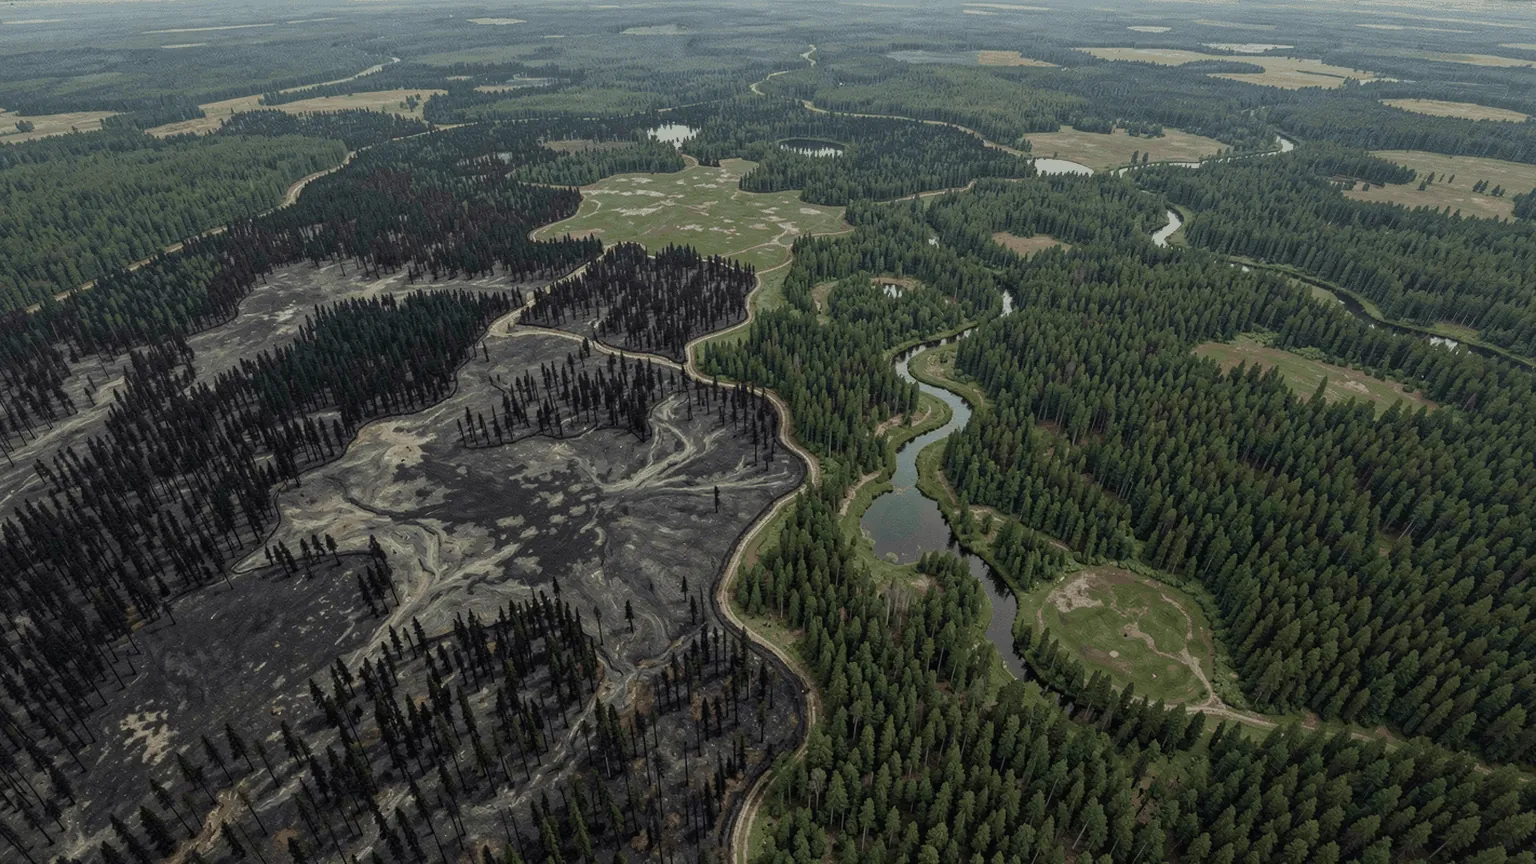
In 1992 Barbara Drossel and Franz Schwabl let trees grow back slowly on such a grid and struck it with lightning now and then. The forest never settled: fires cleared patches, trees filled them back in, and the grid became a patchwork of stands of every density, some above the threshold and some below. The fire sizes came out as a power law, with no parameter tuned to make them. This is the model Malamud and his colleagues compared with real fires. It is a caricature. Fire does not jump only between touching squares; heat reaches further, wind carries it, and damp fuel swallows it. For that we need a partial differential equation.
The Fire PDE
The fire model of Jan Mandel and his colleagues, built for wildfire forecasting, tracks two fields: a temperature $u$ above the surrounding air, and the fraction $f$ of fuel left at each point. Heat diffuses, drifts with the wind, is released when fuel burns and leaks away to the air:
Fuel burns at a rate that switches on sharply with temperature, the Arrhenius law of chemistry:
Everything here is dimensionless. $D$ sets how far heat spreads, $\mathbf{w}$ is the wind, $g$ the loss to the air, $b$ how sharp ignition is. $Q$ is the heat a unit of fuel releases after the water in it has been boiled off, so it is the dryness of the season: damp fuel spends most of its heat drying itself. We put the equation on a patchy forest: a square grid of patches, each carrying fuel with probability $p$ and nothing otherwise. The equation is solved on the whole grid, gaps included, so heat can cross a gap if there is enough of it.
Algorithm — A Fire on a Patchy Forest
input:  p     share of patches that carry fuel
        Q     dryness: heat released per unit of fuel
        wx, wy   wind, in patches per unit time
        D = 0.2,  g = 0.2,  b = 4,  Δt = 0.1

for every patch k:  f[k] <- 1 with chance p, else 0
u <- 0 everywhere;  u <- 2 where lightning strikes

repeat until u < 0.05 everywhere:
    for every patch k at once, from the old values:
        lap  <- u[N] + u[S] + u[W] + u[E] − 4·u[k]
        adv  <- |wx|·(u[k] − u[upwind in x])
              + |wy|·(u[k] − u[upwind in y])
        r    <- exp(b·(1 − 1/u[k])) if u[k] > 0.05,
                else 0
        f'   <- f[k]·exp(−r·Δt)       burn exactly
        u[k] <- u[k] + Δt·(D·lap − adv − g·u[k])
                + Q·(f[k] − f')       heat released
        f[k] <- f'

burnt <- the patches whose fuel fell below one half
edges:  a patch outside the grid copies its neighbour
Two choices keep it honest. The fuel is burnt with the exact exponential, so a hot patch can never burn more fuel than it has, whatever the time step; and the heat released is exactly $Q$ times the fuel that went. The board below runs this loop in your browser. Started from the same forest and the same strike as the Python solver, it burns exactly the same 7,437 patches.
The Board
It opens on a forest right at its threshold: 62% of patches carry fuel, and the dryness is 4.5. Strike it in a few places. Some strikes die after a few patches, and some run away across the whole forest. Neither the forest nor the weather differs between them, only where the lightning landed. Then nudge the dryness to 4.2 and strike again, and to 4.8. Finally set it back, add a light wind, and watch the fire stretch downwind and cross gaps that stopped it before.
The Threshold Moves
First, a check. On the same random forests, pure percolation, where fire passes only between touching patches, switches at a fuel density of 0.594, against the exact 0.5927. The PDE switches somewhere else, and where depends on the weather.
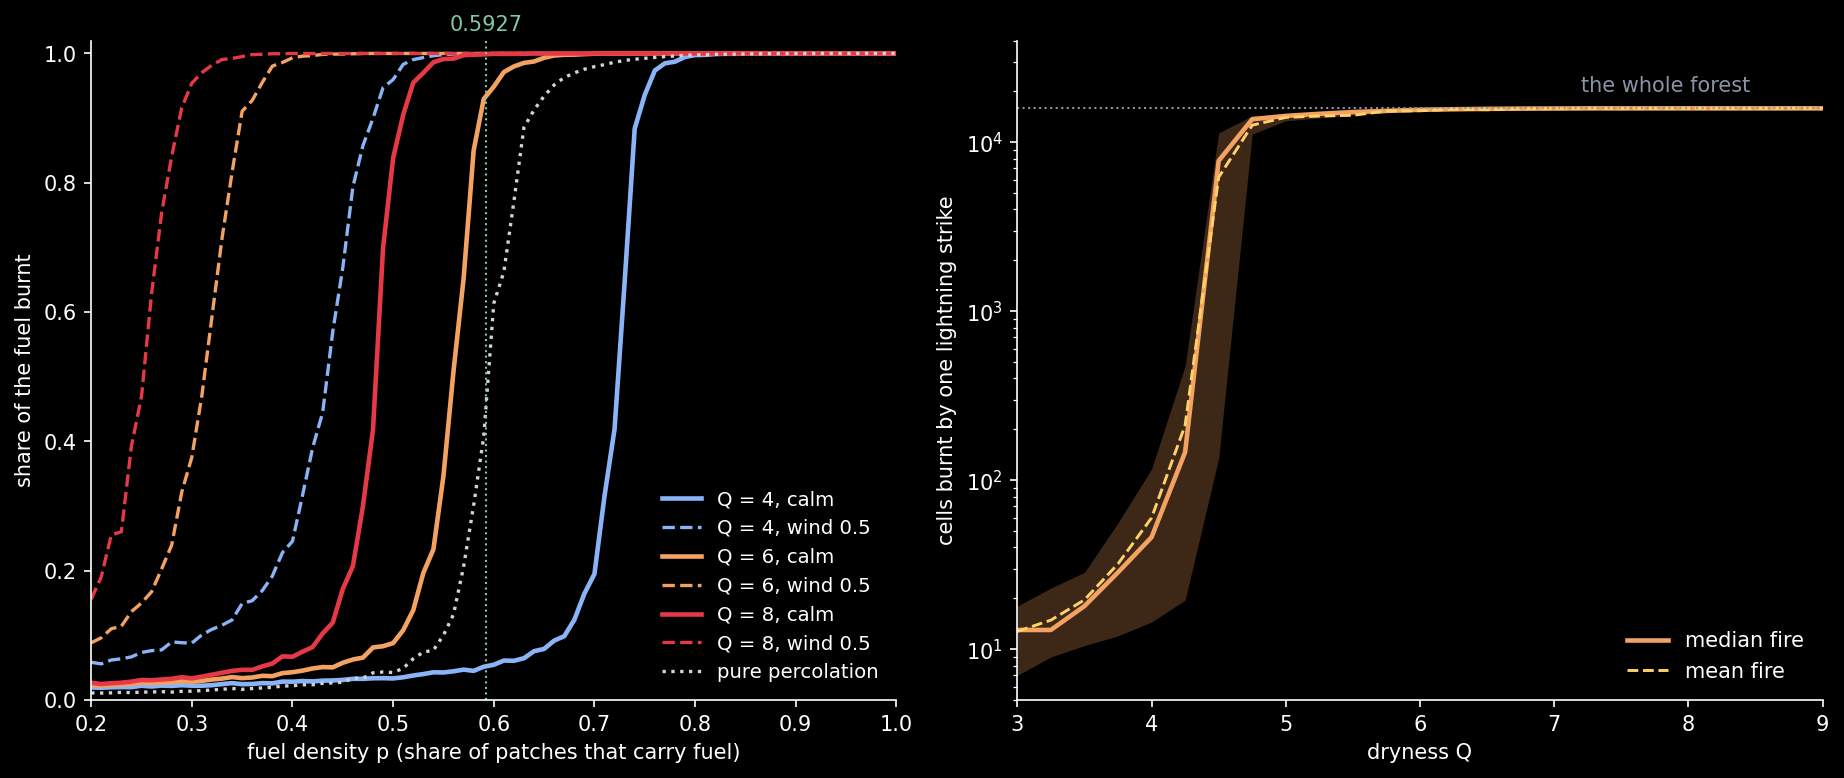
Without wind, the threshold sits at a fuel density of 0.72 at dryness 4, 0.56 at dryness 6 and 0.48 at dryness 8. With a tailwind of 0.5 it falls to 0.43, 0.31 and 0.25, and with a wind of 1.0 to 0.31, 0.22 and below 0.20.
Three things are going on. Damp fuel raises the threshold above percolation’s: at dryness 4 a burning patch cannot heat even a touching neighbour reliably, and the fire needs 72% of patches to carry fuel. Dry fuel lowers it below: at dryness 8 there is enough heat to jump a gap, and 48% will do. Wind lowers it further, because heat carried downwind preheats fuel ahead of the front. A tailwind of 0.5 takes a forest that is safe at dryness 6, with 50% fuel, and burns all of it.
The threshold is not a property of the forest. It is a property of the forest in its weather.
Same Forest, Three Summers
Now fix the forest and change only the weather. Take one forest with 62% fuel, strike it once in the middle, and run it at three levels of dryness.
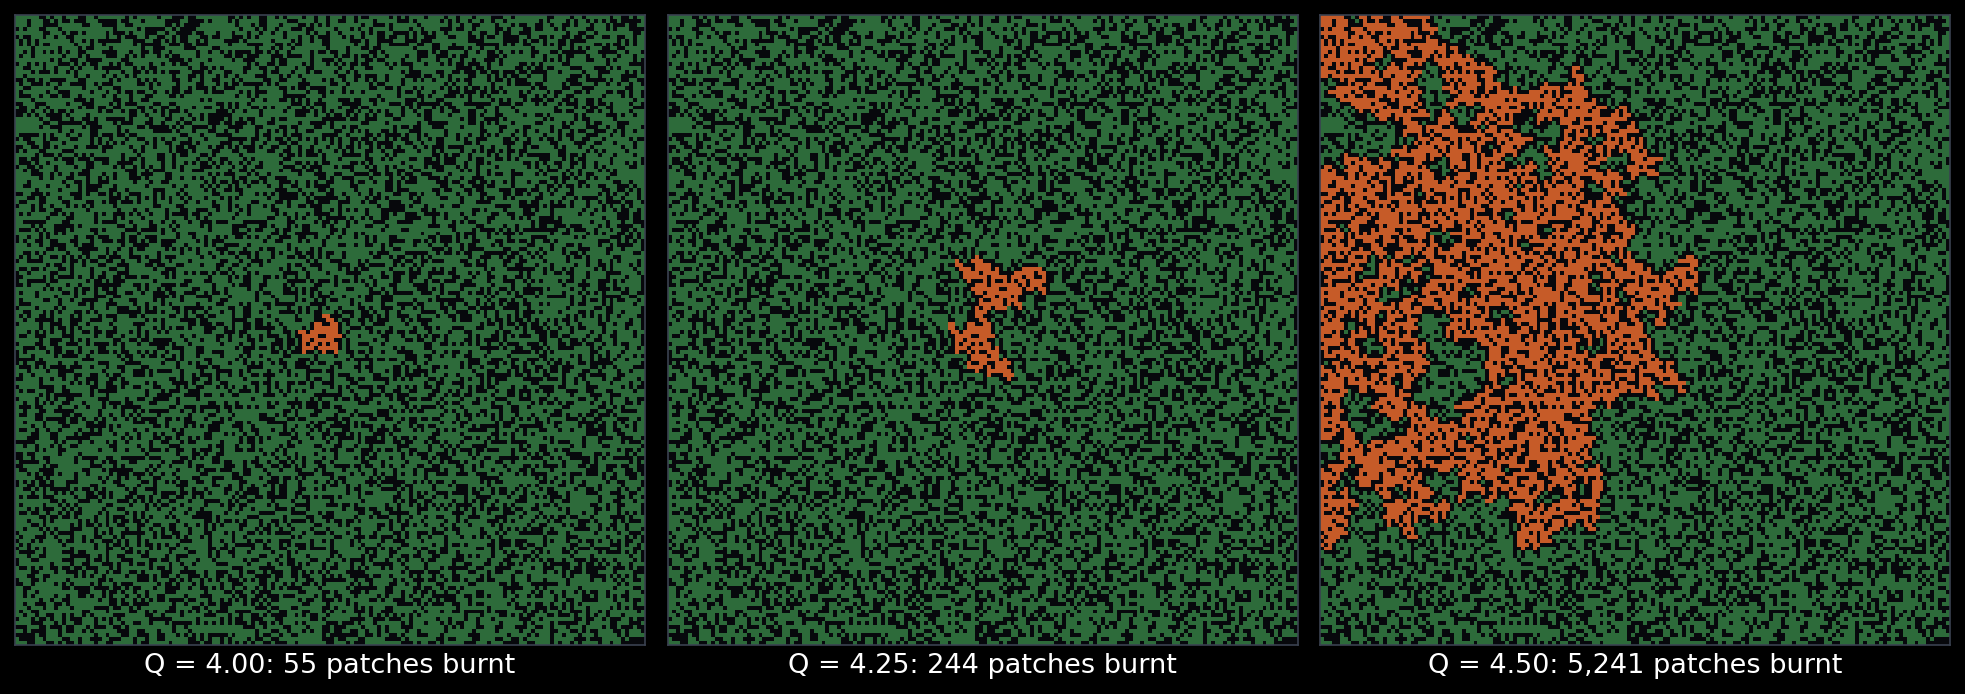
At dryness 4.00 the fire burns 55 patches. At 4.25 it burns 244. At 4.50 it burns 5,241, and stops only where it hits the edge of the map or runs into a gap it cannot cross. Over 96 strikes at each level, each on its own forest, the average fire is 60 patches at 4.00, 211 at 4.25 and 6,209 at 4.50. Fuel that is 12.5% drier makes the average fire 104 times larger.
This is the explanation of Figure 2. The number of fires is set by ignitions, by lightning and by people, and it does not care where the landscape stands. The area is set by whether the landscape is above or below its threshold, and near the threshold a small change in dryness is a huge change in area. The forty BC seasons look like a landscape living in that zone. 2020 had 668 fires and burned 14,548 hectares. 2021 had 1,649, not even three times as many, and burned 866,343, sixty times as much.
Spring Is a Season Too
The dryness also moves within a year, and the record shows it. August has the most fires, 32% of all of them. But fires that started in July burned 45% of all the area, more than any other month, because a fire that starts in July has the rest of the summer’s heat ahead of it.
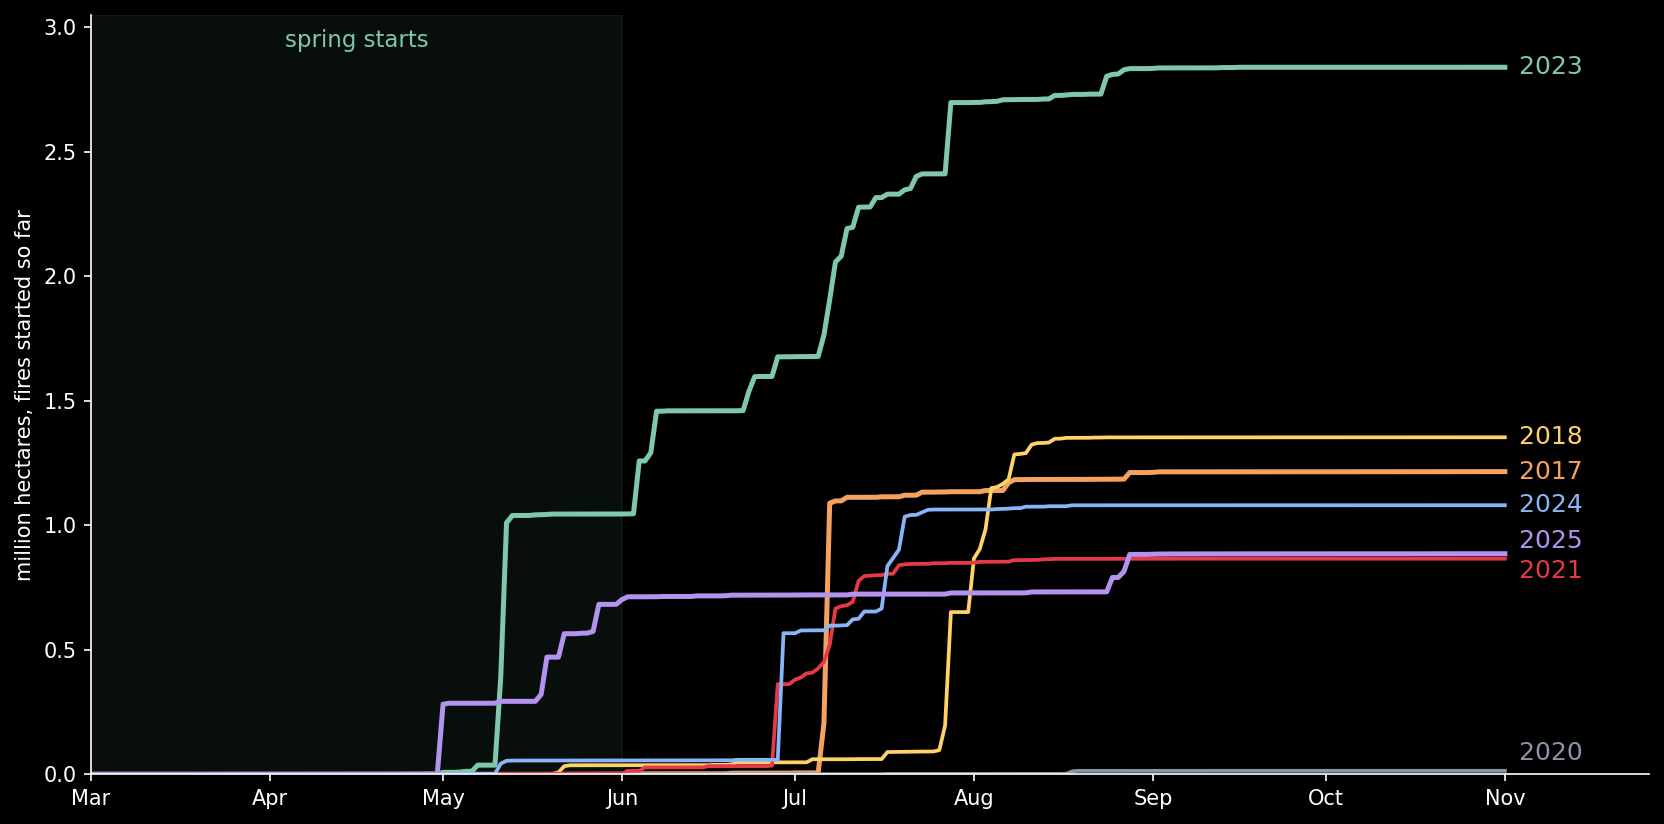
Read the curves as staircases. Each season climbs in a few steps, and each step is one fire or a few that started within days of each other. 2017 took its biggest step on 7 July, when a fire west of Quesnel and Williams Lake started that would burn 521,012 hectares, 43% of the season. 2021 took its steps from the end of June, 2018 at the end of July and in early August. 2023 and 2025 are different: they climbed in May. Fires that started between March and May burned 1,045,861 hectares in 2023, 37% of that season, and 683,035 hectares in 2025, 77% of it. In all thirty-seven seasons from 1986 to 2022 together, spring fires had burned 460,192 hectares, and in the 1990s never more than 18,008 in a season. 2025’s largest fire started on 1 May, 62 kilometres from Fort Nelson.
In the northeast, spring comes before the green. The snow goes, the wind dries last year’s dead grass and leaves, and the new growth is not yet out: for a few weeks the dryness is high before the land has greened up. In the map above, switch off every month except March to May and step through the seasons: through the 1990s the spring layer is dots and a few small circles; in 2023 and 2025 it holds most of the area. Bald Range, this August, is the other kind: a summer fire in a heat dome, the pattern of 2017, 2018 and 2021.
What Can Be Moved
The model has three knobs, and the weather holds two of them. Nobody sets the dryness or the wind. The third, the fuel density $p$, is the only one people can move, with fuel breaks, thinning, prescribed burns and the cultural burning that Indigenous nations have long practised.
Percolation says what to aim for. You do not need to remove the fuel, only its connections: enough to bring the landscape from just above its threshold to just below. At dryness 6 without wind, a line fire burns 98% of a forest with 62% fuel, and 14% of a forest with 52%. Taking away one patch in six turns a fire that crosses the forest into one that stays local.
The same table shows the limit. With a tailwind of 0.5, the fire burns 99% of a forest with only 40% fuel. In the model, wind undoes most of what thinning buys: it is safety for ordinary weather, and much less for the windy, dry days on which a fire can make its run.
There is also an old argument that fire suppression pushes the landscape the wrong way. Every small fire put out leaves its fuel in place, so over decades the fuel stays connected and $p$ drifts up toward the threshold. Richard Minnich made the case in 1983 by comparing southern California, where fires were fought, with Baja California, where they were not: the northern side burned in fewer, larger fires. It is an argument, not a settled fact, and in forests where the weather decides it is weaker. But it is exactly what a percolation model predicts, and it fits the eras above, far fewer fires and far more area, though a warmer, drier climate fits them too.
What the Model Leaves Out
A lot. The forest is a grid of random, independent patches; real fuel is clumped by soil, slope and history, and clumping moves the threshold. There is no terrain, and fire runs uphill. There is no spotting: real fires throw embers kilometres downwind, which lowers the threshold far more than a warm breeze does. The weather here is constant, while real dryness and wind change by the hour. Everything is dimensionless, so a dryness of 4.5 is not a forecast for any real hillside. The record has limits too: each fire is a point with a final size, not a perimeter, and Figure 8 dates fires by the day they were reported, not the days they burned.
What survives the simplification is the shape. Ignitions scale gently, area jumps, and the jump is set by where the landscape stands relative to a threshold that dryness and wind move around. Forty years of BC records show exactly that shape: a count that barely moves, an area that swings a thousand-fold, and a tail that has been getting heavier.
The number of fires burning tonight says how many sparks landed. What this August will cost depends on how many of them landed in a forest that is, this week, above its threshold.
Sources
- BC Wildfire Service, “Wildfire season summary”, Government of British Columbia, https://www2.gov.bc.ca/gov/content/safety/wildfire-status/about-bcws/wildfire-history/wildfire-season-summary
- Natural Resources Canada, Canadian Wildland Fire Information System, National Fire Database, fire point data (file of 11 August 2026), https://cwfis.cfs.nrcan.gc.ca/en/fire-history
- BC Wildfire Service, “BC Wildfire Fire Locations – Current”, BC Data Catalogue, Open Government Licence – British Columbia, https://catalogue.data.gov.bc.ca/dataset/bc-wildfire-fire-locations-current
- Al Jazeera, “British Columbia wildfire forces more than 20,000 to flee, destroys homes”, 8 August 2026, https://www.aljazeera.com/news/2026/8/8/british-columbia-issues-evacuation-orders-ahead-of-fast-moving-wildfires
- CNBC, “Canada’s British Columbia declares state of emergency as more than 20,000 flee wildfires”, 9 August 2026, https://www.cnbc.com/2026/08/09/british-columbia-declares-emergency-more-than-20000-flee-wildfires.html
- B. J. Stocks, J. A. Mason, J. B. Todd, E. M. Bosch, B. M. Wotton, B. D. Amiro, M. D. Flannigan, K. G. Hirsch et al., “Large forest fires in Canada, 1959–1997”, Journal of Geophysical Research: Atmospheres 107, D1 (2002).
- B. D. Malamud, G. Morein and D. L. Turcotte, “Forest fires: an example of self-organized critical behavior”, Science 281 (1998) 1840–1842.
- S. R. Broadbent and J. M. Hammersley, “Percolation processes”, Mathematical Proceedings of the Cambridge Philosophical Society 53 (1957) 629–641.
- M. E. J. Newman and R. M. Ziff, “Efficient Monte Carlo algorithm and high-precision results for percolation”, Physical Review Letters 85 (2000) 4104–4107.
- B. Drossel and F. Schwabl, “Self-organized critical forest-fire model”, Physical Review Letters 69 (1992) 1629–1632.
- J. Mandel, L. S. Bennethum, J. D. Beezley, J. L. Coen, C. C. Douglas, M. Kim and A. Vodacek, “A wildland fire model with data assimilation”, Mathematics and Computers in Simulation 79 (2008) 584–606.
- A. Clauset, C. R. Shalizi and M. E. J. Newman, “Power-law distributions in empirical data”, SIAM Review 51 (2009) 661–703.
- R. A. Minnich, “Fire mosaics in southern California and northern Baja California”, Science 219 (1983) 1287–1294.
- Natural Earth, 1:50m states and provinces and 1:10m populated places, public domain, https://www.naturalearthdata.com
Every number in the text, the figures and both boards come from the scripts archived with this post: the fire statistics from the National Fire Database record for British Columbia, the model from one PDE solver whose results were saved once and which the fire board reproduces patch for patch.
Interested in applying these ideas to your work? Get in touch.