The Tanks That Counted Themselves
Two Ways to Count a Panzer
In Italy the Allies met a new German tank, the Panther: long gun, sloped armour, very hard to kill. The command’s working assumption was that it was an unusual heavy tank, and would turn up in northern France only in small numbers. Then, shortly before D-Day, rumours started that there were a great many of them.
How many tanks was Germany actually building each month? The invasion plans depended on the answer, and two groups set out to find it.
The first did it the way intelligence is usually done: aerial photographs of factories, prisoners, captured papers, agents’ reports. Every source pointed at a big, busy industry, and the estimate came out at around 1,400 tanks a month.

The second group was a few economists and statisticians, and they looked at something the first group had walked straight past. German factories stamped serial numbers on the parts of every tank — gearboxes, chassis, engines — and the gearbox numbers ran in two unbroken sequences. Every wrecked or captured tank was, in effect, a page torn out of the factory’s ledger with its page number still on it.
From those numbers alone they said 246 a month.
After the war the Allies opened the production records of Albert Speer’s ministry. The true figure was 245.
Spies with cameras: 1,400. Men with notebooks and a burnt-out gearbox: 246. The truth: 245.
That tidy trio is the way the story gets retold, averaged over June 1940 to September 1942. The original 1947 paper by Ruggles and Brodie gives a messier table month by month, and it is just as brutal. For June 1941 the serial numbers said 244, intelligence said 1,550 and the records said 271. For August 1942 it was 327, 1,550 and 342. Their worst month was June 1940: 169 from the serial numbers, against 122 in the records — and 1,000 from intelligence. The statisticians were once off by nearly 40%. The spies were off by a factor of four and a half to eight, every time.
The Problem, Stripped to the Bone
Number the tanks $1, 2, \ldots, N$. You capture $k$ of them at random and read their numbers. What is $N$?
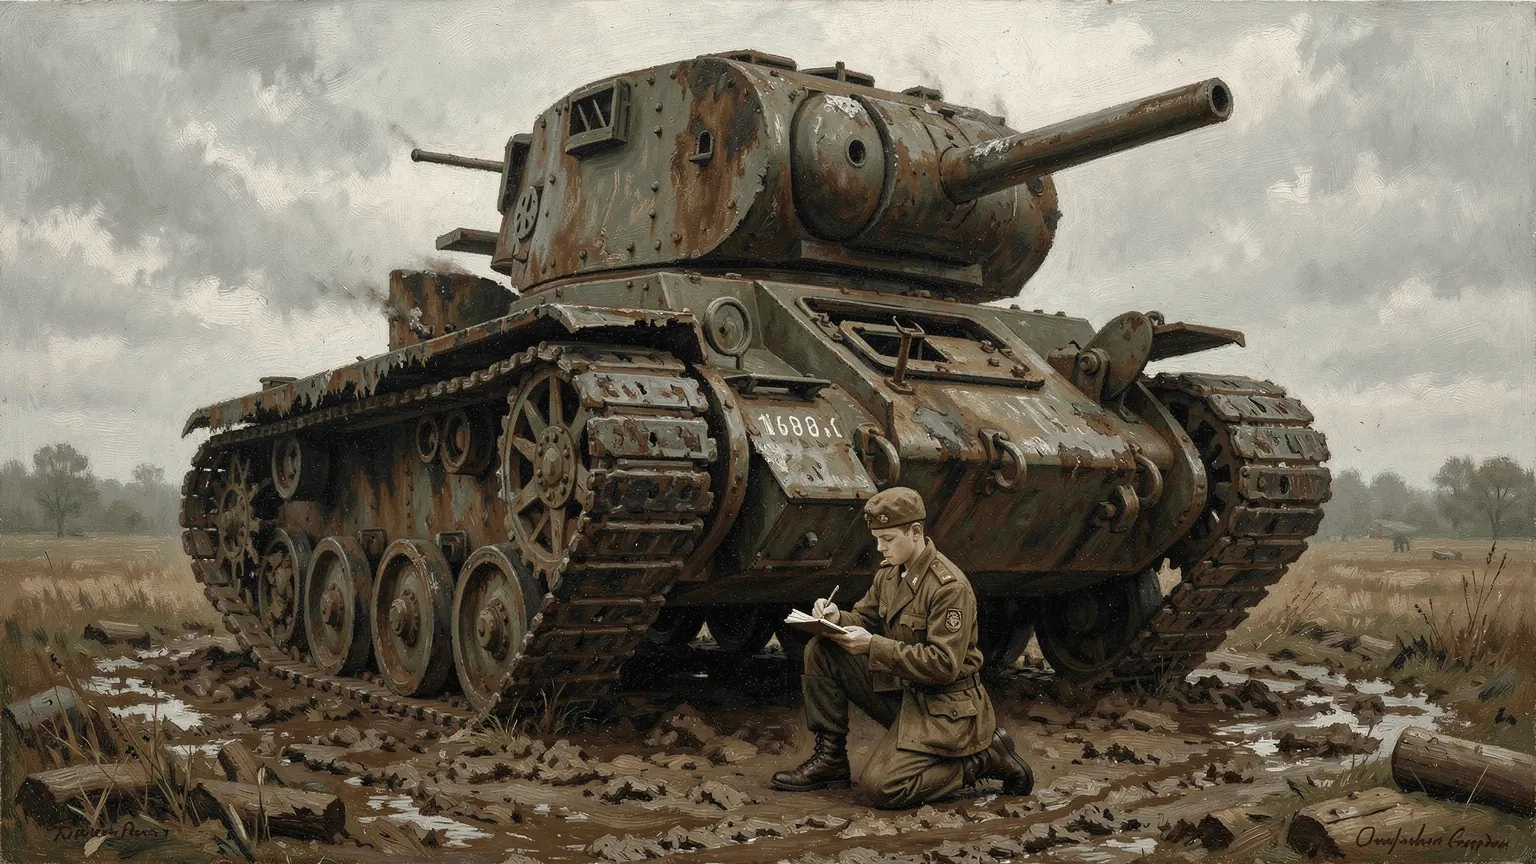
Here are five captured tanks. Their numbers are 4, 21, 58, 171 and 175. (They were drawn at random from a factory that built 245, but pretend you do not know that.)
The first instinct is the average. Serial numbers are spread evenly from $1$ to $N$, so their average should sit near the middle, and doubling it should land near $N$. The average here is $85.8$, which gives an estimate of $2 \times 85.8 – 1 = 170.6$ tanks.
Look at that answer for a moment. You are standing next to tank number 175, and the average has just told you the factory built fewer than 175 tanks.
The second instinct is better. The largest number you saw, $m = 175$, is a hard floor: at least that many were built. It is also almost certainly short, because the largest of five random draws is rarely the very last tank. How far short? The five numbers chop the range $1$ to $N$ into six gaps, and by symmetry the gaps are the same size on average. There are $m – k$ unseen numbers below the largest, spread over $k$ gaps, so an average gap is $(m-k)/k$. The largest number leaves exactly one gap above it. Add one average gap:
For our five tanks that is $\hat N = 175 + 34 = 209$. The truth was 245, so it is off by 36 — which is about what this estimate is typically off by with five tanks. Its expected value and its spread are exact:
So $\hat N$ is right on average, and with five tanks from a factory of 245 its standard deviation is 41. It is also the best there is: no other estimate that is right on average has a smaller variance.
And the spies? If the factory had really built 1,400 tanks, the chance that five captured ones would all carry numbers of 175 or less is about one in 34,000. Five wrecks were enough to rule out the entire intelligence estimate. They also cap it from above: at 95% confidence, a factory whose five largest numbers top out at 175 has built no more than 316.
Throw Away the Other Four
Something in that estimate should bother you. It uses one number, the largest. You captured five tanks, and four of their serial numbers never entered the calculation.
Surely using all five does better. It does not, and not by a little: once you know the largest number, the other four carry no information about $N$ at all.
The reason fits in one line. Given that the largest of the $k$ numbers is $m$, every possible set of the other $k-1$ numbers below $m$ is equally likely:
$N$ does not appear on the right. Whatever the factory built, the numbers below the largest are just a random scatter below it, and a scatter that looks the same from every factory cannot tell you which factory you are looking at. In the language of statistics, the maximum is sufficient.
You can watch this happen. Simulate two factories, one that built 245 tanks and one that built 400. Capture five at a time, a few million times each, and keep only the captures whose largest number happens to be exactly 240. From the factory of 245 the other four numbers average $120.09$; from the factory of 400, $119.68$. The exact answer is $120$ for both, and their whole distributions match to within one serial number at every quantile from 5% to 95%. The four numbers you were tempted to average cannot tell a factory of 245 from a factory of 400.
This is also why the average does so badly. It is diluted by four numbers that carry no information, and it pays for them in spread: with five tanks its standard deviation is 63, against 41 for the largest-plus-a-gap. One in five times it overshoots 300, which $\hat N$, built on a maximum that cannot exceed 245, never does.
The difference grows with every tank you capture:
The average’s error shrinks like $1/\sqrt{k}$ — the same wall every Monte Carlo estimate hits, the one this blog wrote about in The 1/√N Wall. The maximum’s error shrinks like $1/k$. The wall is simply not there, because the information does not sit in the middle of the data, where averaging slowly finds it. It sits at the edge, and one observation can land right on it.
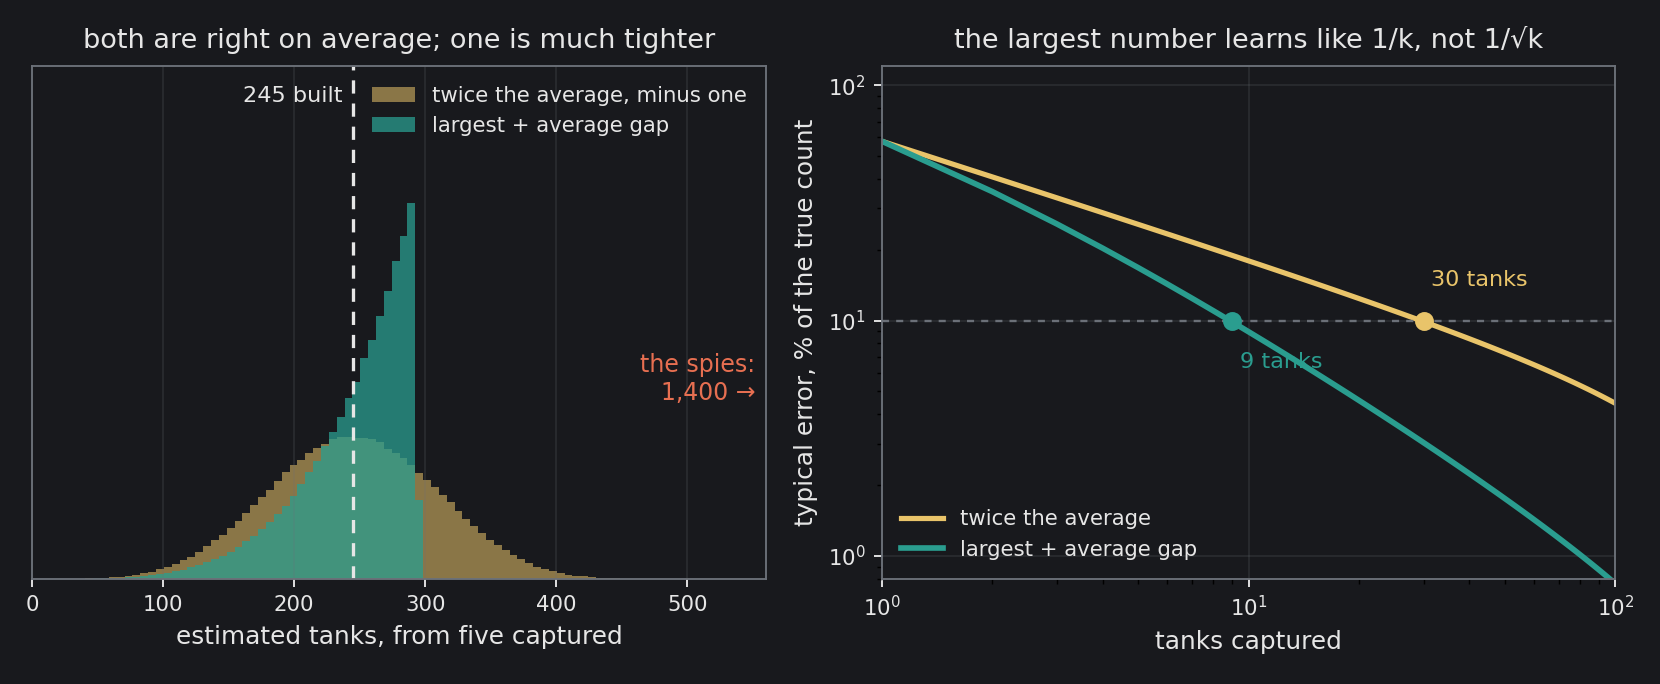
To get within 10% of the truth you need 9 captured tanks if you use the largest number, and 30 if you use the average.
Algorithm — Count the Tanks
input:  serial numbers s_1 .. s_k, read off k captured tanks

# ---- the estimate -------------------------------------------
m     <- max(s)                    # the ONLY number that matters
N_hat <- m + (m - k) / k           # the largest, plus one average gap
sd    <- sqrt( (N_hat - k) * (N_hat + 1) / (k * (k + 2)) )

  Every other serial number is thrown away, and nothing is lost:
  given m, the rest are a uniform scatter below it whatever N is.

# ---- how large could it be? ---------------------------------
N_95  <- the largest N with  C(m, k) / C(N, k) >= 0.05

  C(m, k) / C(N, k) is the chance that k tanks from a factory of N
  all carry numbers <= m. Past N_95, a maximum this small would be
  a 1-in-20 accident.

# ---- the check, sharing nothing with the above --------------
simulate a factory of known size N, capture k tanks, a million times
report the mean and spread of N_hat against the formulas above
condition on max = m in two factories of different size, and
compare the other k-1 numbers: they must be the same

return N_hat, sd and N_95
The Best Version Needed Two Tanks
The cleverest use of the trick did not use gearboxes at all.
A tank’s road wheels were cast in moulds, and each mould stamped its number into every wheel it made. Two captured tanks, 32 road wheels each, gave 64 mould numbers. The same kind of serial-number estimate turned those into the number of moulds in use, and British wheel manufacturers could say how many wheels one mould turns out in a month. The answer was 270 tanks in February 1944, noticeably more than had been suspected.
The German records for that month: 276.

The Ledger Was the Leak
Why did Germany number its parts in order at all? Because that is what good engineering does. When a gearbox fails in the field you want to know which batch it came from, and which other tanks carry its siblings. Quality control is a ledger, and a ledger kept in sequence is a count.
The discipline that made the tanks reliable was the same discipline that counted them for the other side. The spies were looking for a secret. The statisticians noticed that the enemy had already written the answer down and stamped it on the evidence.

The trick has outlived the war. It has been run on the serial numbers of rockets, of computers — one count of Commodore 64s came out at 12.5 million, matching the low end of other estimates — and of anything else that leaves a factory with a number in order.
Which is why the identifier on every paper on this site, like WP-2026-80309110, ends in eight random digits rather than a counter. Now you know why that matters.
Sources
- R. Ruggles and H. Brodie, “An Empirical Approach to Economic Intelligence in World War II”, Journal of the American Statistical Association 42 (1947) 72–91.
- L. A. Goodman, “Some Practical Techniques in Serial Number Analysis”, Journal of the American Statistical Association 49 (1954) 97–112.
- The 1,400 / 246 / 245 comparison as retold by Gavyn Davies in The Guardian, 20 July 2006.
Every other number here is computed by the script archived with this post.
Interested in applying these ideas to your work? Get in touch.