
The 1966 Retiree
Thirty Years, Twice
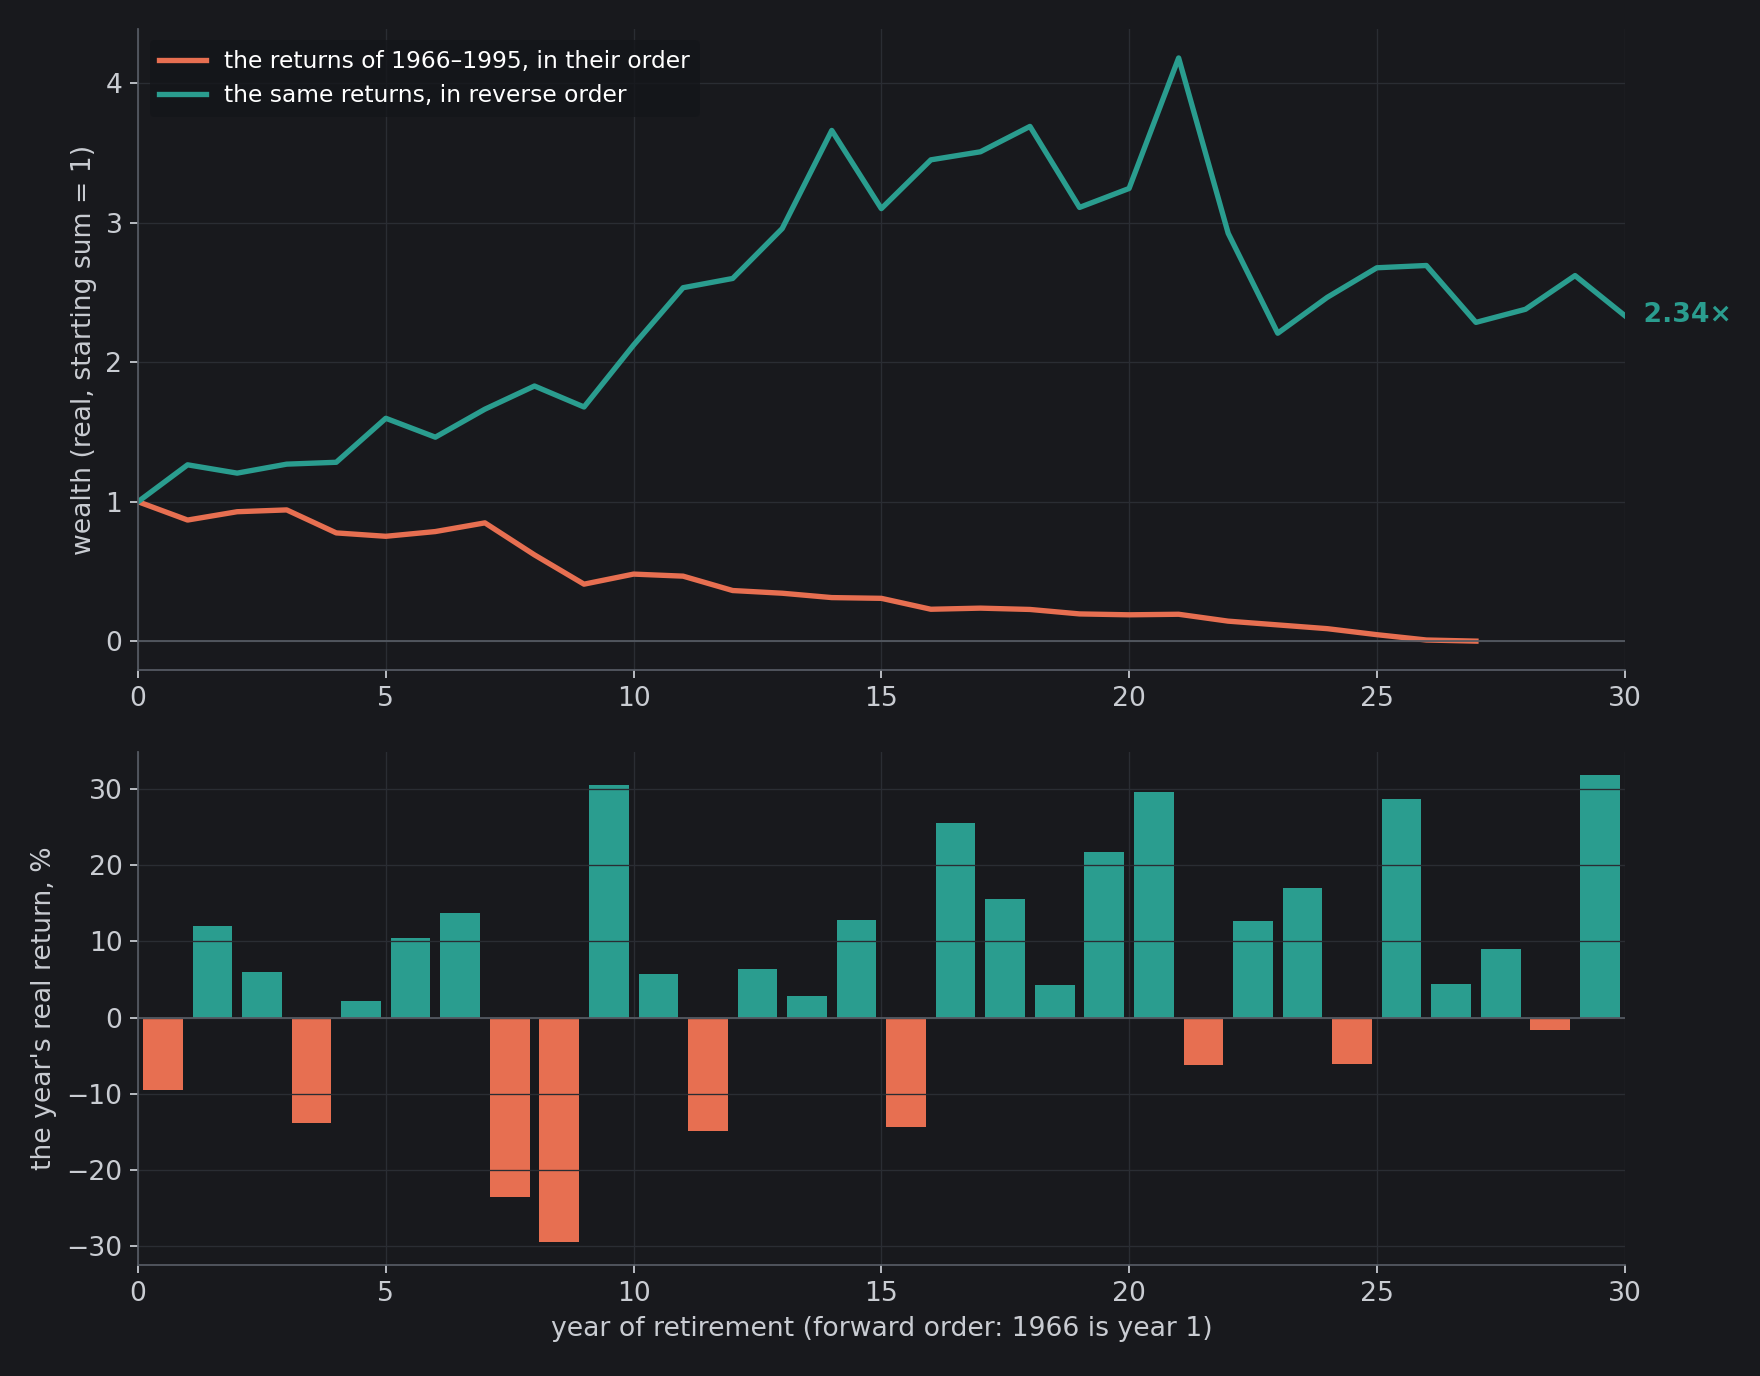
Suppose you retired in January 1966 with your savings in the American stock market, dividends reinvested, and drew 4% of the starting sum in the first year, raising the amount with inflation every year after. That is the rule most retirement planners have heard of. Over the next thirty years the market returned 4.87% a year after inflation, more than you were taking out, and your money still ran out, in the 27th year, 1992.
Now take the same thirty years of returns and play them backwards. Same years, same average, opposite order. You finish with 2.34 times what you started with.

The rule is William Bengen’s. In October 1994 Bengen, a financial planner in El Cajon, California, ran every retirement he could build from Ibbotson’s data, starting in each year from 1926 to 1976, half in common stocks and half in intermediate-term Treasury notes, and concluded that a first-year withdrawal of 4%, raised with inflation, “should be safe. In no past case has it caused a portfolio to be exhausted before 33 years”. His worst case was a retirement begun in 1966. This post runs the rule through every retirement since 1871, finds what each start year could actually have afforded, explains why the order of the years matters more than their average, and then solves the question in closed form: with the market as a Brownian motion, what is the chance that a fixed withdrawal ever exhausts the money?
126 Retirements
Robert Shiller publishes the American stock market’s monthly real total return from 1871, dividends reinvested and inflation removed, and the real total return of ten-year Treasury bonds alongside it. A retirement here starts in January, withdraws the same real amount at the start of every year, and leaves the rest in the market, rebalanced every month between stocks and bonds. It runs out when a withdrawal finds less than it needs. With thirty years of data needed after each start, there are 126 retirements, beginning from 1871 to 1996.
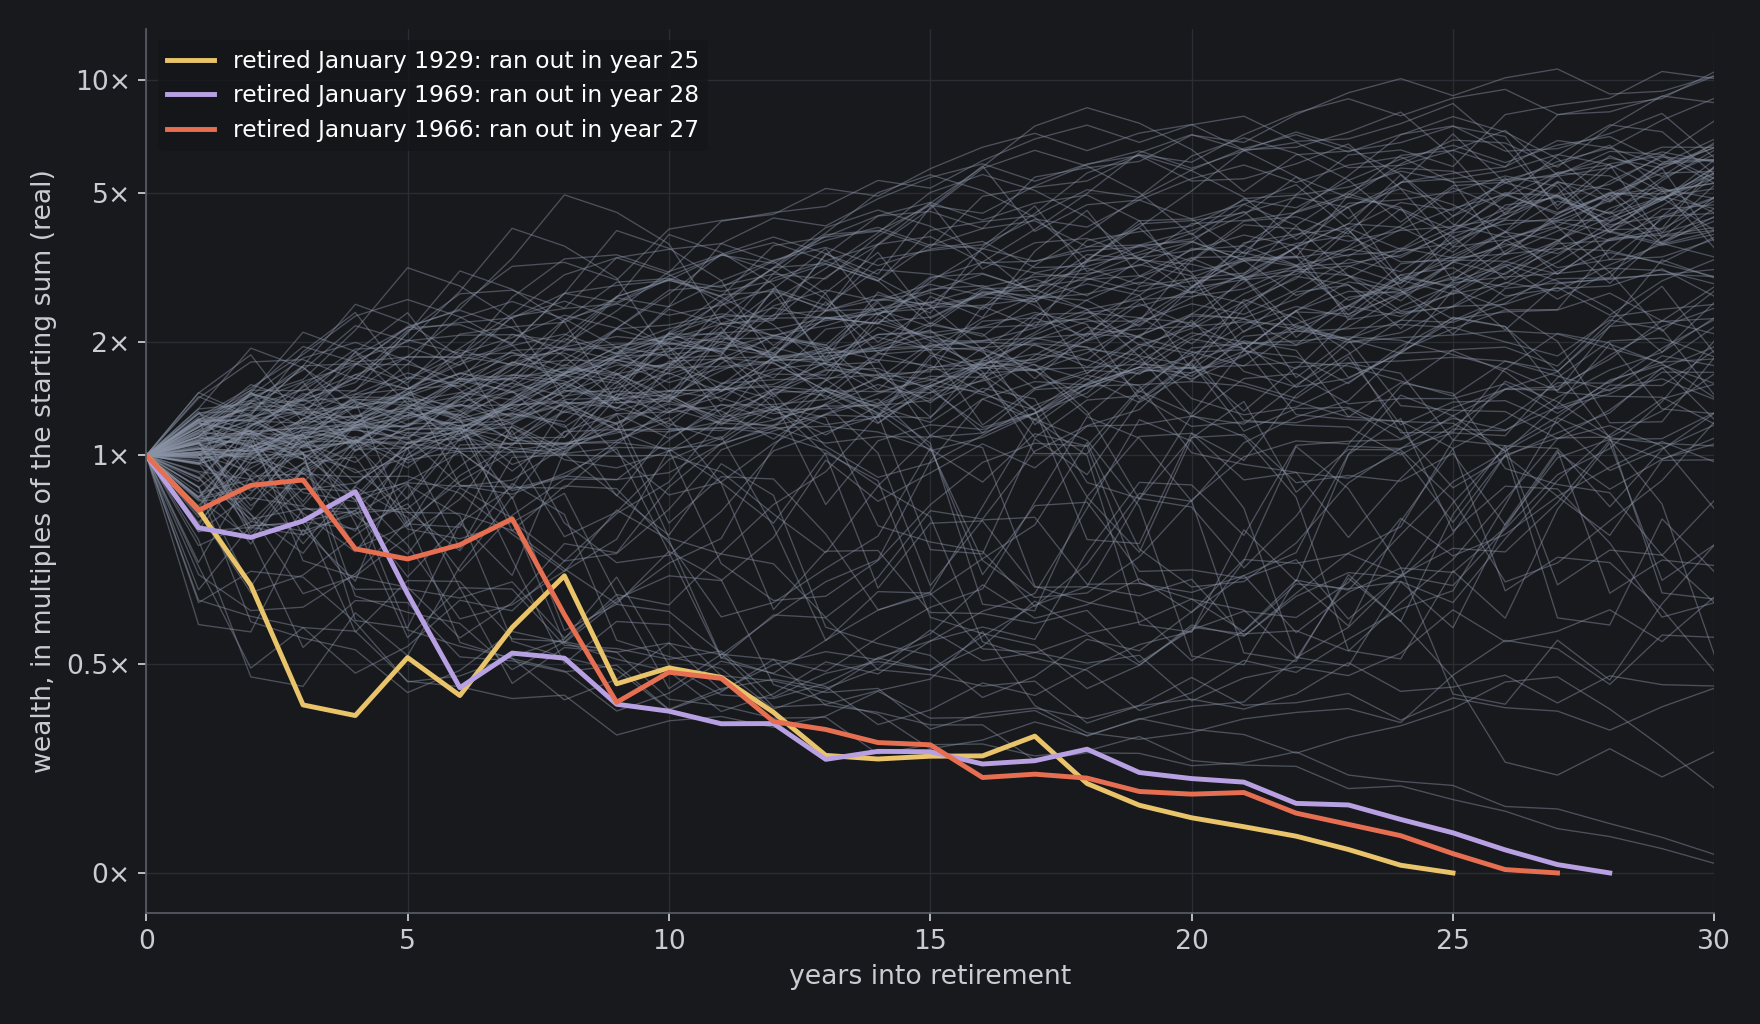
At 4% a year, all in stocks, 3 of the 126 ran out: those that began in 1929, 1966 and 1969. Half in stocks and half in bonds, 6 ran out, all of them begun between 1964 and 1969. Then the rule falls off a cliff. At 4.5% the failures were 10 all in stocks and 21 half and half; at 5% they were 24 and 40. One more point of withdrawal multiplied the failures eight times for the all-stock retiree.
Bengen’s own test never failed at 4%, and the difference is in the details. He held intermediate-term notes, which lose less than ten-year bonds when rates rise, and he took each year’s withdrawal at the end of the year rather than the start. Shiller’s series has ten-year bonds, and a retiree here eats first, so the half-and-half retirements of 1964 to 1969 run out between their 25th and 30th years. Moving the withdrawal to the end of the year alone cuts those six failures to two, the retirements of 1965 and 1966, and the all-stock failures from three to two. The rule sits close enough to the edge that such details decide whether it held.
The Same Years, Backwards
The 1966 retiree’s thirty years were not bad on average. They were bad first. In the first ten the market lost 1.8% a year after inflation, through the bear markets and the inflation of the late 1960s and the 1970s; in the last ten it gained 11.0% a year. The withdrawals did not wait. Every January the retiree sold shares to live on, and in the first decade they were cheap, so each year’s 4% took a bigger bite of what was left. By the time the good years came, there was too little left for them to work on. Planners call this sequence-of-returns risk.
Reverse the order and the same withdrawals are paid out of a portfolio that has already grown. The average return is identical, 4.87% a year, and the outcome is the opposite: 2.34 times the starting sum after thirty years of withdrawals. For money left alone, the order of the returns makes no difference: the same returns multiply to the same total in any order. For a retiree who takes money out, the order is nearly everything.
What Each Year Could Afford
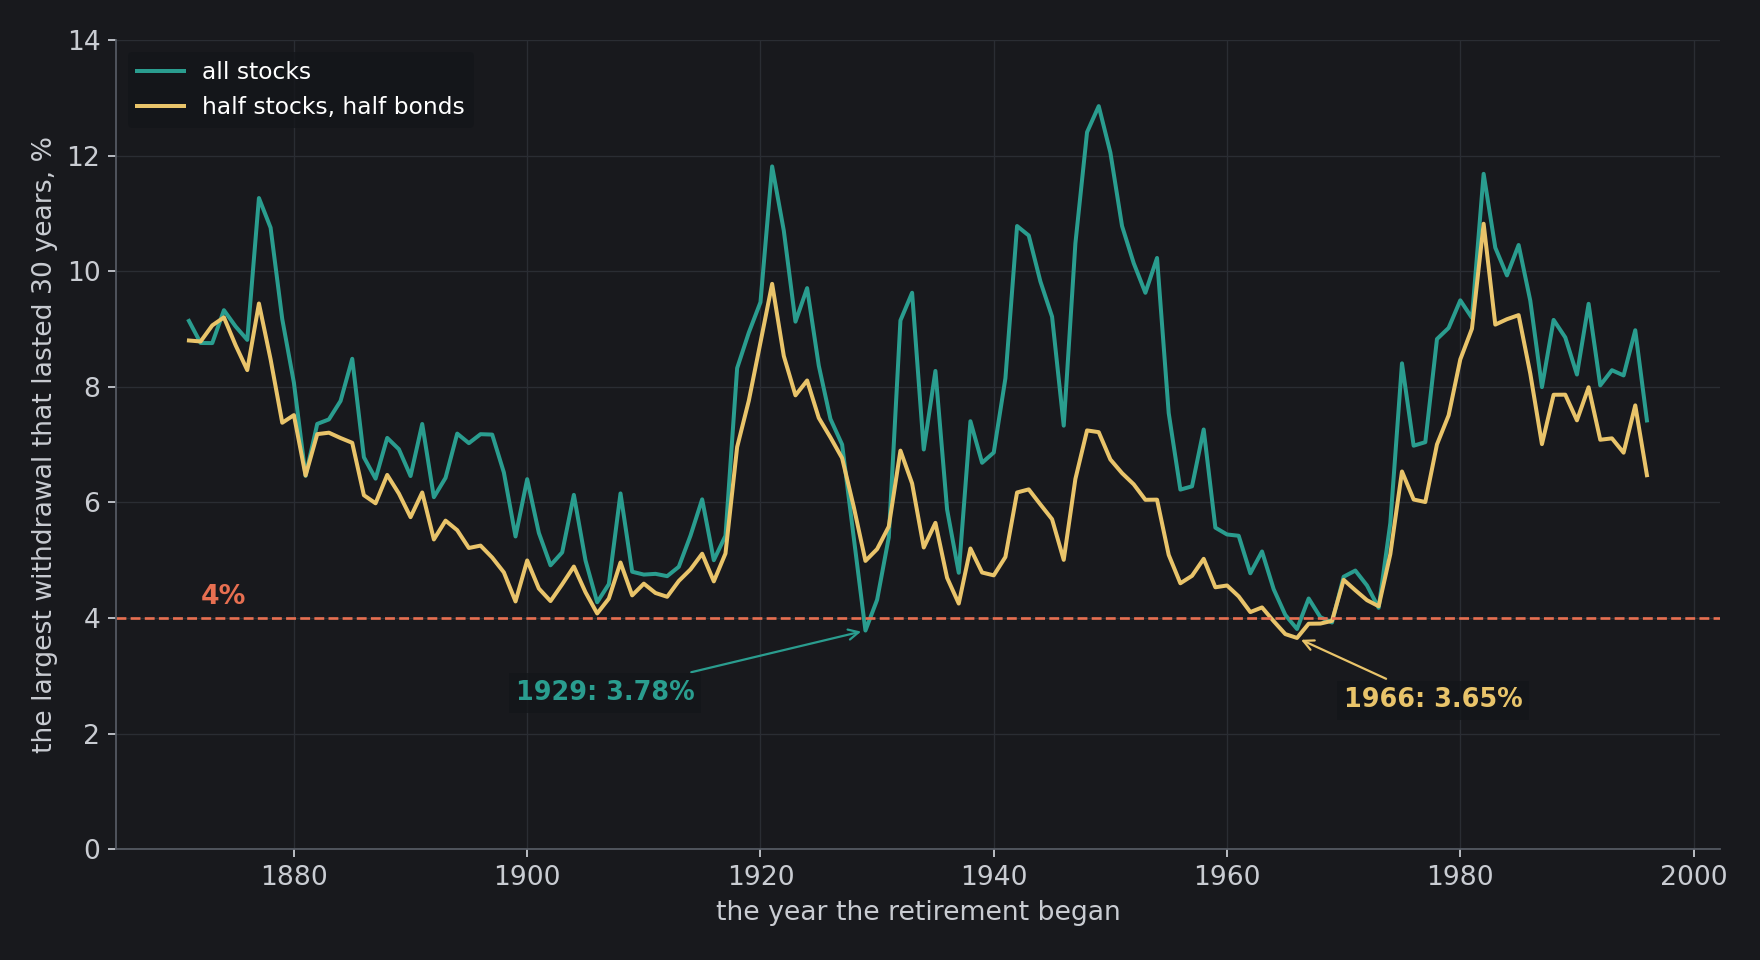
Turn the question around. For each start year, what is the most that could have been drawn and still last thirty years? The answer swings wildly. All in stocks, it was 3.78% for a retirement begun in 1929 and 3.81% for one begun in 1966, the two worst; the median start year could have drawn 7.29%; and a retiree of 1949 could have drawn 12.86% a year for thirty years. Half in stocks, the worst was 3.65%, again 1966, the median 6.00% and the best 10.82%, in 1982.
So the 4% rule is not what a typical retirement could afford. It is, almost exactly, what the worst one could. Four years after Bengen, three professors at Trinity University ran the test on the S&P 500 and corporate bonds from 1926 and called withdrawals of 3% and 4% from stock-heavy portfolios “exceedingly conservative behavior”.
Forever, in Closed Form
History gives 126 answers, and they overlap: a retirement begun in 1966 and one begun in 1967 share 29 of their 30 years. To get a probability, model the portfolio as a geometric Brownian motion with drift $\mu$ and volatility $\sigma$, withdraw at a constant real rate $w$, and ask whether the money ever runs out. The equation is linear, and it solves exactly:
The money runs out exactly when the present value of all the withdrawals, discounted at the market’s own random return, exceeds the starting sum. That present value is an exponential functional of Brownian motion, and in 1990 Daniel Dufresne showed that it has a known law: changing the clock so that the Brownian motion runs at the right speed turns it into the reciprocal of a gamma variable. Marc Yor studied such functionals at length, and in 2000 Moshe Milevsky and Chris Robinson used Dufresne’s law to price the risk of ruin in retirement.
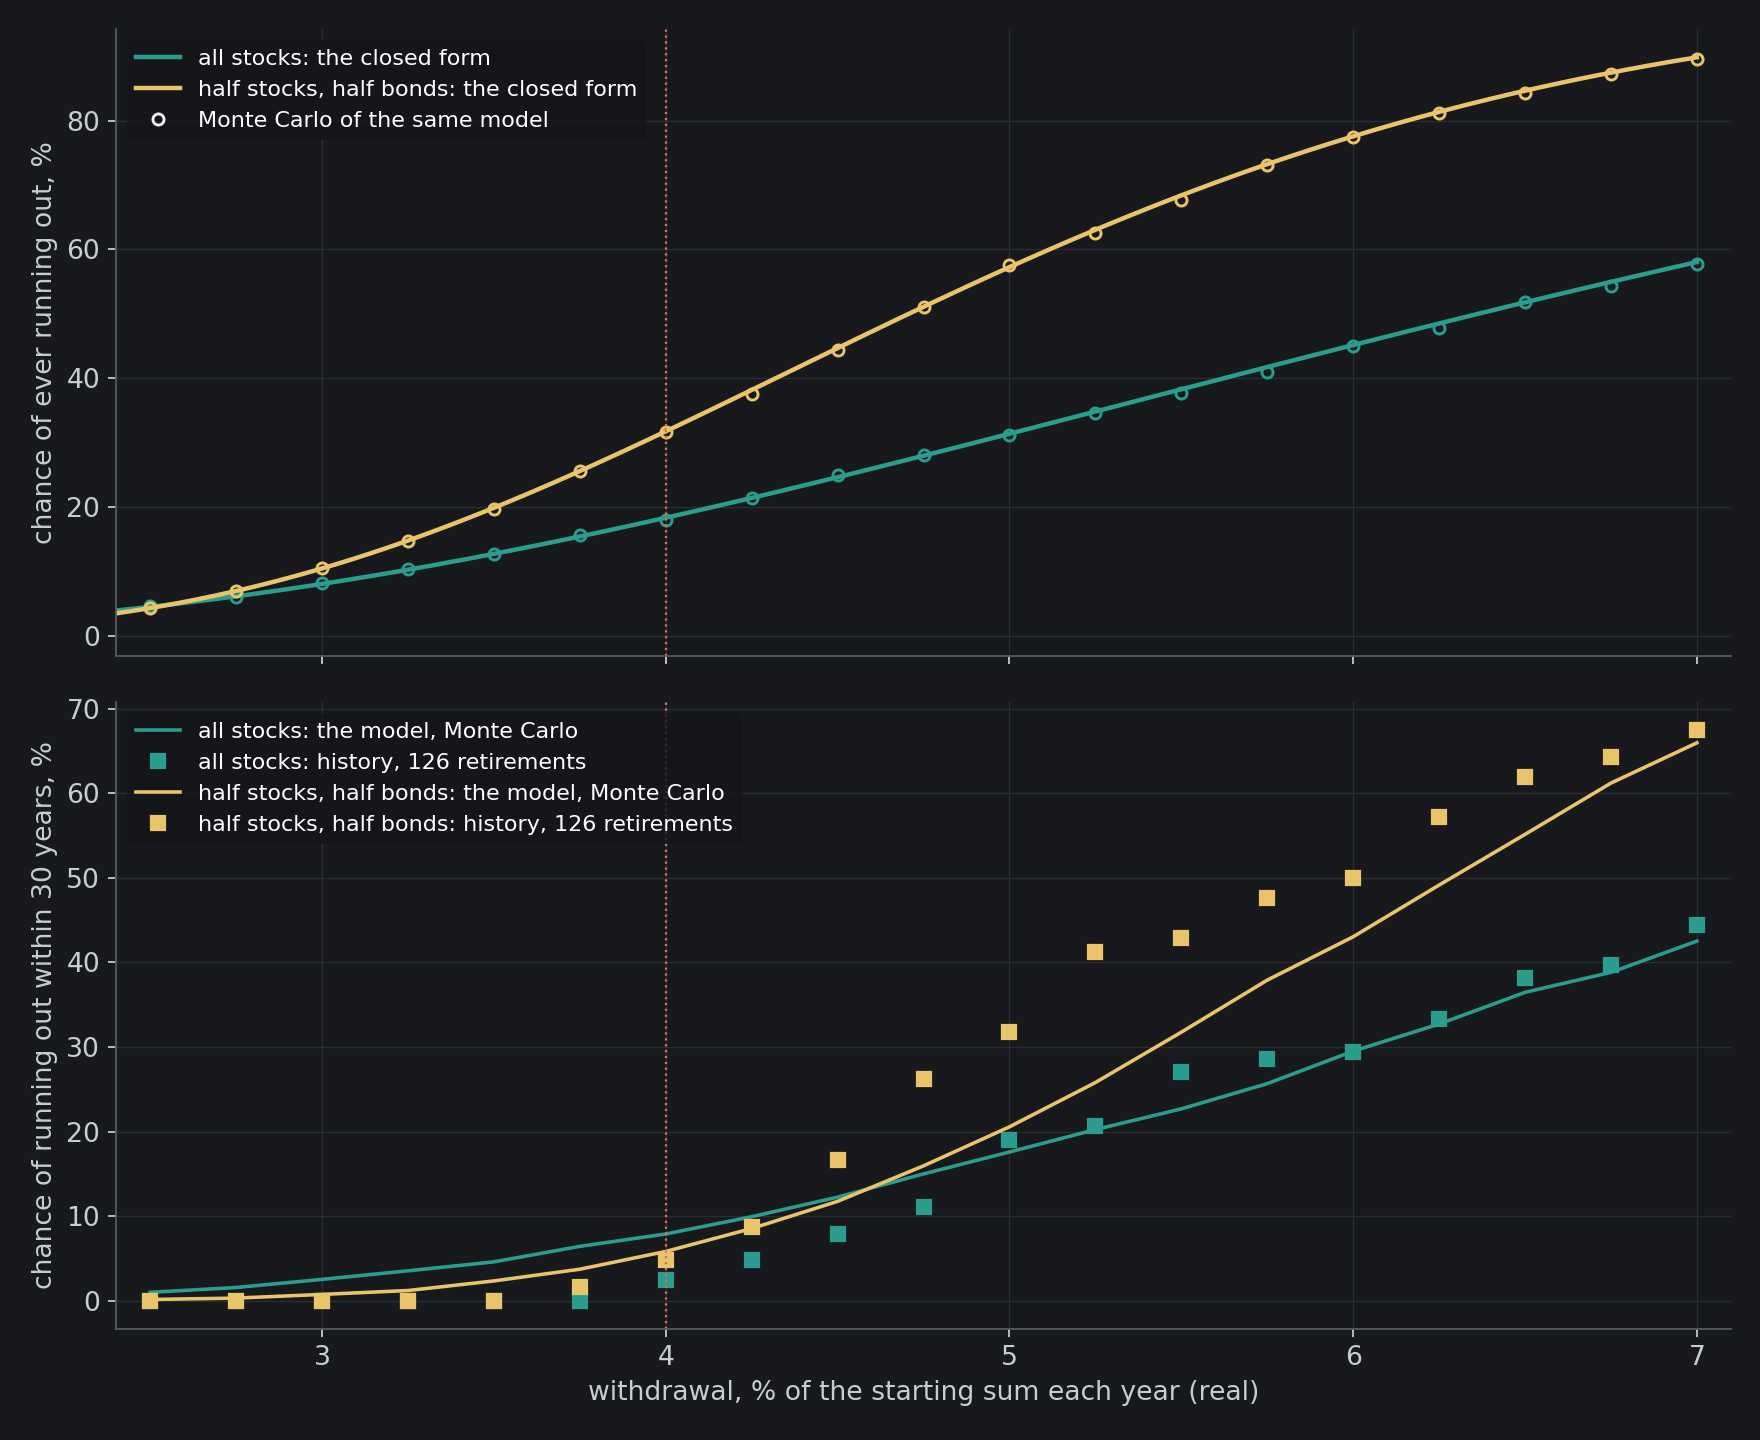
$P$ is the regularized incomplete gamma function, one line in any statistics library. Read off the market’s history, all in stocks, $\mu$ is 8.32% a year and $\sigma$ is 17.15%, from the January-to-January real returns since 1871 (Shiller’s prices are monthly averages, which hide part of the month-to-month volatility, so annual returns are used). That gives $\nu = 4.66$, and the chance that 4% a year ever runs out, drawn forever, is 18.3%. A Monte Carlo run of the same model, 20,000 portfolios over 200 years, gives 17.9%. At 3% the closed form says 8.0%, at 5% it says 31.4%. Half in bonds, $\nu$ is 9.26 and the chance at 4% is 31.7%: forever, the lower return of bonds matters more than their calm.

Thirty Years Is Not Forever
A retiree needs thirty years, not forever, and there the model has no closed form, but Monte Carlo answers in seconds. Drawing 4% from an all-stock portfolio, the model runs out within thirty years 7.9% of the time; history ran out 2.4% of the time, 3 retirements of 126. Half in bonds the two agree better, 5.8% in the model and 4.8% in history. History has been kinder to the all-stock retiree than a model of independent years, which is one reason the 4% rule earned its reputation, and a reason not to lean on it harder than the record does.
Try It
The board runs any retirement since 1871. Choose the start year, the withdrawal, the share in stocks and the horizon, and read whether the money lasted, what the same years would have done in reverse order, the most that start year could have afforded, how many of history’s retirements ran out at your rate, and the closed-form chance of running out forever. I read its cards back in a browser at eight settings against Python, and checked the post’s own numbers against the board: all agree.
Algorithm — A Retirement Through History, and Its Chance Forever
input:  monthly real returns of stocks rs_k and bonds rb_k (Shiller),
        stock share s, withdrawal w, start month k0 (a January), horizon H
W ← 1
for each month m = 0 … 12H − 1:
    if m is a January:  if W < w: ran out in year m/12 + 1;  W ← W − w
    W ← W · (1 + s rs_k + (1 − s) rb_k),  k = k0 + m  (k0 + 12H − 1 − m reversed)
safe maximum of a start: the largest w that lasts H years (bisection)
forever, in closed form:
    log returns of each year → σ² (their variance), μ ← mean + σ²/2
    ν ← 2μ / σ² − 1;  P(ruin) ← P(ν, 2w / σ²)
check: Monte Carlo of the same model, 20,000 portfolios, 200 years
check: the model's 30-year chance against history's 126 retirements
Bengen’s Number
Bill Bengen trained as an aeronautical engineer at MIT, then spent seventeen years in his family’s soft-drink franchise business in the New York area, rising to president, before it was sold and he moved to southern California to become a financial planner; he finished a master’s degree in financial planning in 1993, the year before the paper. He kept working on the number. Adding small-company stocks, he raised it to 4.3% in 1997 and to 4.5% in a 2006 book; in A Richer Retirement, published in August 2025, twelve years after he sold his practice and retired, a portfolio of seven asset classes took it to 4.7%, with a retiree of October 1968 as the worst case. Morningstar’s survey of December 2025 puts the safe starting rate for a 30-year retirement at 3.9%, with a 90% chance of money left at the end.
None of these numbers is what a typical retiree can spend: in Shiller’s record the median start year could have spent 7.29%. They answer a different question, how much would have survived the worst stretch in the record, and the worst stretch comes first only for the unlucky. The retiree of 1966 had the market’s average, and lost to its order. The closed form prices not knowing in advance which retiree you will be: drawing 4% from stocks forever, about one chance in five that the market’s own randomness eventually runs the money out.
Sources
- W. P. Bengen, “Determining withdrawal rates using historical data”, Journal of Financial Planning 7 (4) (1994) 171–180; his career from the article’s author note.
- R. J. Shiller, “U.S. Stock Markets 1871–Present and CAPE Ratio” (ie_data.xls, shillerdata.com): Real Total Return Price and Real Total Bond Returns.
- Sequence-of-returns risk: M. Kitces, “Understanding sequence of return risk: safe withdrawal rates, bear market crashes, and bad decades”, kitces.com, 1 October 2014.
- P. L. Cooley, C. M. Hubbard and D. T. Walz, “Retirement savings: choosing a withdrawal rate that is sustainable”, AAII Journal 20 (2) (1998) 16–21.
- D. Dufresne, “The distribution of a perpetuity, with applications to risk theory and pension funding”, Scandinavian Actuarial Journal 1990 (1) 39–79.
- M. Yor, “On some exponential functionals of Brownian motion”, Advances in Applied Probability 24 (1992) 509–531; the identity as stated in H. Matsumoto and M. Yor, “Exponential functionals of Brownian motion, I”, Probability Surveys 2 (2005) 312–347, Theorem 6.2.
- M. A. Milevsky and C. Robinson, “Self-annuitization and ruin in retirement”, North American Actuarial Journal 4 (4) (2000) 112–124.
- Bengen’s 4.3% and 4.5%: D. Duquette, “Revisiting William Bengen’s SAFEMAX portfolio withdrawal rate”, Journal of Financial Planning, November 2023.
- W. P. Bengen, A Richer Retirement: Supercharging the 4% Rule to Spend More and Enjoy More, Wiley (2025); the 4.7% and its worst case as reported in AAII Journal, August 2025.
- Bengen’s retirement in 2013: Financial Advisor magazine, 18 September 2013.
- A. Arnott, C. Benz and J. Kephart, The State of Retirement Income, Morningstar, December 2025.
Every number in the text, the charts and the board are computed by the scripts archived with this post from Robert Shiller’s monthly series of real total returns, 1871 to 2026, with a Monte Carlo of the model run once and saved.
Interested in applying these ideas to your work? Get in touch.