The Win Rate That Means Nothing
Nine Winners in Ten
A day trader who wins nine trades in ten sounds like someone worth copying. Here is how anyone can do it, on any stock,
starting tomorrow. Buy, and place two orders at once: a take-profit 10 cents above the entry and a stop 90 cents below it.
On a price with no predictable direction, the target is hit first 90% of the time. The trader shows a 90% win rate and
makes exactly nothing before costs. After costs, the trader loses.
The win rate is not a measure of skill. It is a setting, chosen at the moment the two orders are placed.
The Bracket Decides
Over the few minutes of a trade, take the price, measured from the entry, to be a fair random walk $X_t$: no drift, no
way to predict the next tick. The trade ends at $\tau$, the first time the price is up $a$, the target, or down $b$, the
stop. A fair game stays fair at any exit that does not look into the future. That is Doob’s optional stopping theorem,
and it makes the average final move zero. The same argument applied to the square of the price gives the average time
spent in the trade:
Here $p$ is the chance that the target is hit first and $\sigma^2$ is the variance of the price per unit of time. A 10¢
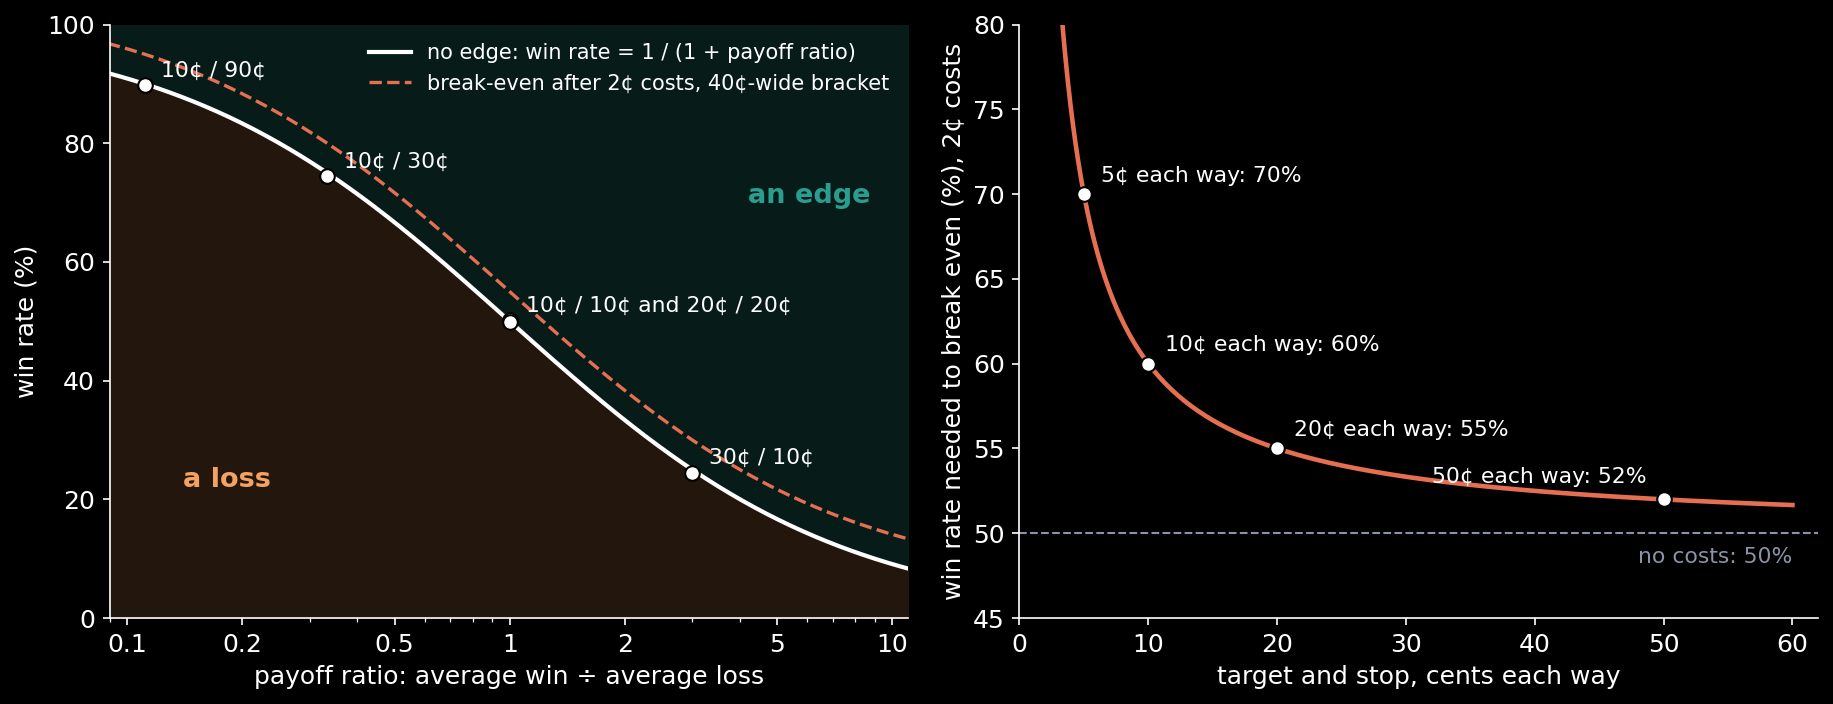
target with a 90¢ stop wins 90% of the time. A 10¢ target with a 30¢ stop wins 75%. A bracket of 20¢ each way wins 50%,
and a 30¢ target with a 10¢ stop wins 25%. Every one of them has an expected profit of exactly zero.
The only thing a high win rate buys is time. In a market that moves a cent at a time, the 90% bracket keeps the trader in
the trade for 900 ticks on average, nine times as long as a bracket of 10¢ each way, which lasts 100.
The Line That Matters
Since the win rate times the average win must equal the loss rate times the average loss, a trader with no edge sits on
one curve, set by the payoff ratio $R$:
A win rate means something only next to the payoff ratio. With winners twice the size of losers, no edge means winning
one trade in three. With winners a ninth of the losers, it means winning nine in ten. “I win 70% of my trades” says
nothing, and neither does “my winners are twice my losers”. Together they are a claim: 70% at a payoff ratio of 2 sits
far above the line. A record above the line is an edge, on the line it is a coin, and below it is a loss.
What Costs Do
A real trade pays for itself: the spread, the commission, the exchange fees, the slippage on a stop. Call it $c$ cents a
share for the round trip; take 2¢. A winner now nets $a – c$ and a loser costs $b + c$, and break-even moves up:
Costs add $c/(a+b)$ to the win rate needed, and they add the most when the bracket is tight. With 2¢ of costs, a bracket
of 20¢ each way needs 55% winners just to break even. At 10¢ each way it needs 60%, and at 5¢ each way, 70%. A scalper
who is right 55% of the time on 20¢ brackets is a better forecaster than a coin, and makes exactly nothing.
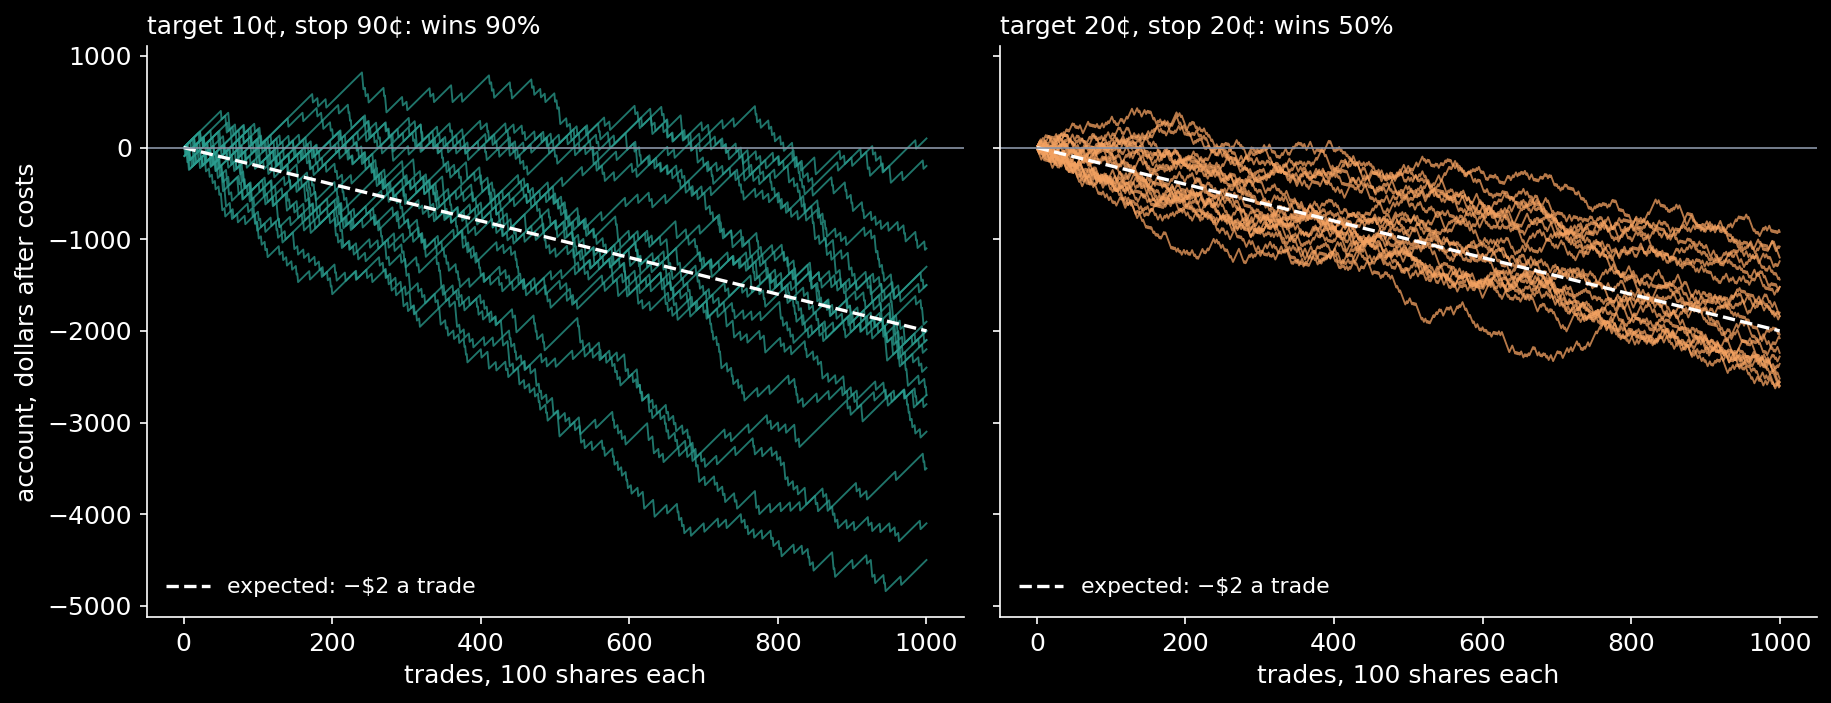
On a fair price every bracket loses the cost, $c$ a share on every trade, whatever its win rate. A thousand trades of
100 shares at 2¢ is $2,000 gone on average, for the 90% trader and the 50% trader alike. What differs is the way it goes.
This is not a thought experiment. A study of every individual who began day trading Brazilian equity futures between
2013 and 2015 found that 97% of those who kept at it for more than 300 days lost money, and only 1.1% earned more than
the Brazilian minimum wage.
Exits Cannot Make an Edge
Few traders use a fixed bracket. They trail the stop, take half off at the first target, close at the bell, add to a
loser. Each of these is a rule for when to get out, or how much to hold, decided from what the price has done so far. On
a fair price none of them can change the expected profit, since a fair game stays fair under any such rule. What they
change is the shape of the outcome.
Averaging down shows it. Buy 100 shares, and if the price falls 20¢, buy 100 more. Take the profit as soon as the
position is 10¢ a share ahead of its average price, and stop out if the price falls 60¢ below the first entry. The
first leg wins two times in three. When it does not, the second leg recovers two times in three. The plan wins 88.9% of
its trades, with an average win of $12.50 and a loss, when it comes, of $100. The expected profit is zero before costs,
and costs take $2.67 a trade on average, since a third of the trades end up holding 200 shares.
The funded-trader challenge runs on the same formula. Grow the account 10% before losing 5%, and a trader with no edge
passes one time in three, before the fee and before costs.
What a Record Must Show
A win rate is a setting, and so is a payoff ratio. What a record can show is its distance above the line, after costs,
and that takes many trades. On a symmetric bracket with no costs, telling a 60% trader from a coin at two standard errors
takes 96 trades, and a 55% trader takes 396. With costs the line to beat is no longer 50%: against the 55% needed on a 20¢
bracket, the same 60% trader needs 384 trades. A streak proves even less. A trader with no edge can stay ahead for most
of a year on luck alone, which is the arcsine law of the previous post.
This is the code that checks the arithmetic in this post. It sends 20,000 trades into each bracket on a fair price that
moves a cent at a time, runs the averaging-down plan, and prints what the text states:
Python 3.13 — Bracket Orders on a Fair Price
import numpy as np

def bracket(a, b, trades, rng):
    """fair 1-cent ticks from the entry until the price is up a or down b:
    the final move in cents, and the ticks it took (theory in brackets below)"""
    x = np.zeros(trades, dtype=np.int64)
    t = np.zeros(trades, dtype=np.int64)
    live = np.arange(trades)
    while live.size:
        x[live] += 2 * rng.integers(0, 2, live.size) - 1
        t[live] += 1
        live = live[(x[live] < a) & (x[live] > -b)]
    return x, t

cost = 2                                        # cents a share, per round trip
rng = np.random.default_rng(20260605)
for a, b in ((10, 90), (10, 30), (20, 20), (30, 10), (10, 10)):
    x, t = bracket(a, b, 20_000, rng)
    print(f"{a}c/{b}c: wins {np.mean(x == a):.1%} ({b / (a + b):.0%}), "
          f"mean {x.mean():+.2f}c, {t.mean():.0f} ticks ({a * b}), "
          f"{(b + cost) / (a + b):.0%} needed after costs")
print(f"5c/5c: {(5 + cost) / (5 + 5):.0%} needed after costs")

# averaging down: 100 shares, 100 more 20c lower; out at +10c on the average
# price, or 60c below the first entry. Dollars a trade, before costs.
x1, _ = bracket(10, 20, 20_000, rng)
added = x1 == -20
x2, _ = bracket(20, 40, int(added.sum()), rng)
pnl = np.where(x1 == 10, 10.0, 0.0)
pnl[added] = np.where(x2 == 20, 20.0, -100.0)
fee = np.where(added, 2 * cost, cost)           # dollars: 100 or 200 shares
print(f"averaging down: wins {np.mean(pnl > 0):.1%}, "
      f"average win ${pnl[pnl > 0].mean():.2f}, mean {pnl.mean():+.2f}, "
      f"costs ${fee.mean():.2f}")

print(f"1,000 trades of 100 shares: ${1000 * 100 * cost / 100:,.0f} of costs")
print(f"a +10% / -5% challenge passed with no edge: {5 / (10 + 5):.0%}")
print(f"roulette's single zero: {1 / 37:.1%} of every bet")
for p, line in ((0.60, 0.50), (0.55, 0.50), (0.60, 0.55)):
    n = 4 * p * (1 - p) / (p - line)**2         # two standard errors
    print(f"trades to tell {p:.0%} from {line:.0%}: {n:.0f}")

# 10c/90c: wins 89.8% (90%), mean -0.18c, 905 ticks (900), 92% needed after costs
# 10c/30c: wins 74.5% (75%), mean -0.20c, 303 ticks (300), 80% needed after costs
# 20c/20c: wins 50.2% (50%), mean +0.09c, 400 ticks (400), 55% needed after costs
# 30c/10c: wins 24.5% (25%), mean -0.19c, 301 ticks (300), 30% needed after costs
# 10c/10c: wins 49.8% (50%), mean -0.04c, 101 ticks (100), 60% needed after costs
# 5c/5c: 70% needed after costs
# averaging down: wins 88.7%, average win $12.44, mean -0.23, costs $2.66
# 1,000 trades of 100 shares: $2,000 of costs
# a +10% / -5% challenge passed with no edge: 33%
# roulette's single zero: 2.7% of every bet
# trades to tell 60% from 50%: 96
# trades to tell 55% from 50%: 396
# trades to tell 60% from 55%: 384
Any bracket can be set to win nine times in ten. None can be set to make money. That part has to come from the price.
Sources
- J. L. Doob, Stochastic Processes, Wiley (1953).
- W. Feller, An Introduction to Probability Theory and Its Applications, Volume I, third edition, Wiley (1968).
- F. Chague, R. De-Losso and B. Giovannetti, “Day trading for a living?”, SSRN working paper 3423101 (2019).
Every number in the text and both charts are computed by the scripts archived with this post: the closed forms, each checked against a simulation of 20,000 trades per bracket on a fair price, saved once. The 2¢ cost is an assumption for illustration; the arithmetic holds for any cost.
Interested in applying these ideas to your work? Get in touch.