
The Sell Order That Fed on Its Own Volume
Twenty Minutes Instead of Five Hours
At 2:32 in the afternoon of 6 May 2010, a mutual fund complex began to sell 75,000 E-mini S&P 500 futures contracts, worth about $4.1 billion, as a hedge against shares it already held. It gave the job to an algorithm with a single instruction: sell at “9% of the trading volume calculated over the previous minute, but without regard to price or time”.
That sounds like a patient instruction. A seller who takes 9% of whatever the market trades hides inside the crowd: when the market is busy it sells more, when it is quiet it sells less, and it never becomes most of the market. The last time the same seller had sold that many contracts, with hand trading and algorithms that watched price and time as well as volume, it took “more than 5 hours”. This time, says the official report of the staffs of the CFTC and the SEC, the algorithm finished “in just 20 minutes”, at least fifteen times faster. In the middle of those twenty minutes the E-mini fell more than 5% in four and a half minutes. It was the Flash Crash.
Nobody told the algorithm to hurry. The market did, and the mathematics of how it did fits in one line, with a number hidden in it: about ten. If each contract the fund sold was traded on about ten more times before anyone kept it, the rule could not settle down. Every sale made the next one bigger.
Volume That Was Not Liquidity
The first buyers of the fund’s contracts were high-frequency traders and other intermediaries, firms that buy and sell all day and hold very little. By the report’s account the high-frequency traders built up a net long position of about 3,300 contracts, and between 2:41 and 2:44 they sold about 2,000 of them back into the market. Then, still short of buyers who meant to keep what they bought, they began “to quickly buy and then resell contracts to each other”, a “hot-potato” effect in the report’s own words. Between 2:45:13 and 2:45:27 they “traded over 27,000 contracts, which accounted for about 49 percent of the total trading volume, while buying only about 200 additional contracts net”. In those 15 seconds the E-mini fell another 1.7%, to its low of the day, 1056.
Every one of those trades counted as volume, and volume was the only thing the fund’s rule listened to. The report says so directly: the algorithm “responded to the increased volume by increasing the rate at which it was feeding the orders into the market, even though orders that it already sent to the market were arguably not yet fully absorbed”. Its pace more than doubled. It sold about 35,000 contracts in the 13 minutes to 2:45, about 2,700 a minute, and the remaining 40,000 or so by about 2:51, about 6,700 a minute. The report drew the lesson in one sentence: “high trading volume is not necessarily a reliable indicator of market liquidity”.
The Loop in One Line
Write the rule down. Count time in minutes, because the rule itself looks back one minute. Let $S_t$ be what the rule sells in minute $t$, and $V$ the volume the market would trade without it. Suppose each contract the fund sells is traded on $m$ more times by intermediaries before a final buyer keeps it. Then the minute’s volume is $V + (1+m)S_t$, and the rule’s next sale is $p = 0.09$ of that:
Starting from nothing sold, this solves in one line:
Everything rests on $r$. Below 1, the sales settle at a steady pace, faster than they would be without the re-trading but steady. At exactly 1, they grow in a straight line, by $pV$ more each minute. Above 1, they grow geometrically, and every sale speeds up the next. The edge is
A rule that sells 9% of the volume is stable only while each contract it sells is passed on fewer than about ten times. Nothing in the rule knows that number, and nothing in the rule can see it being crossed.
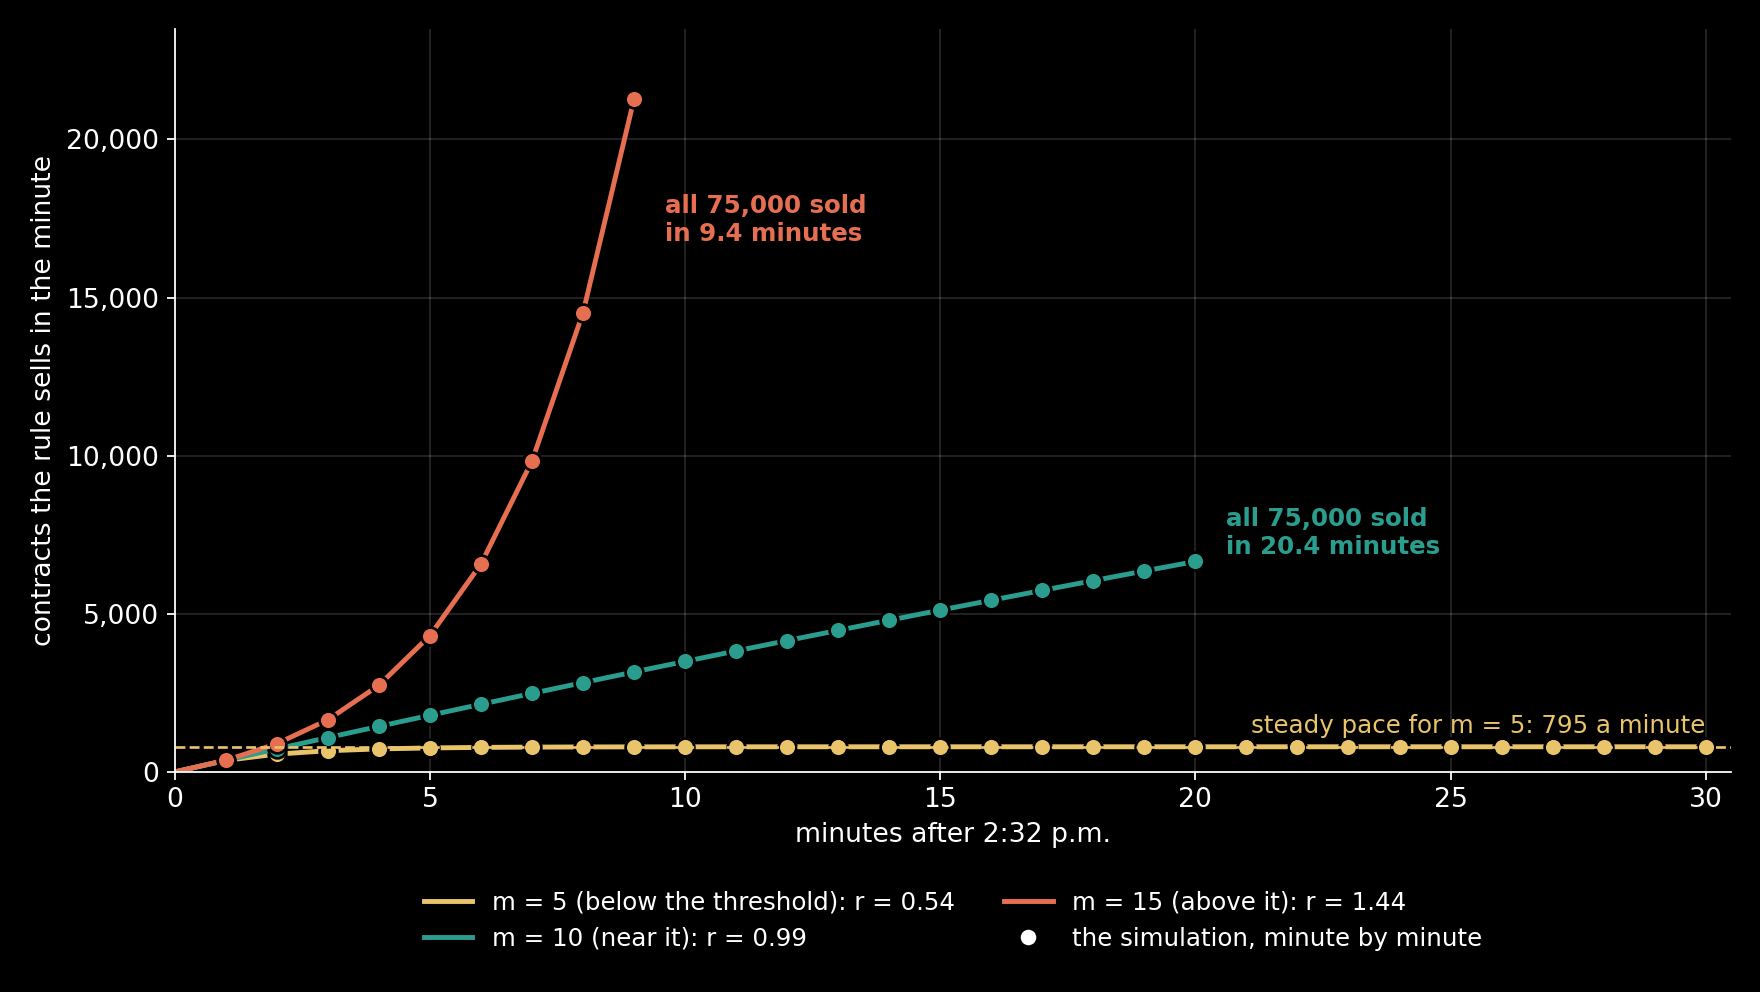
The threshold changes what the size of an order does. In the toy market below, at $m = 5$, selling 75,000 contracts takes 95.6 minutes and selling 750,000 takes 945: ten times the order, ten times the wait. At $m = 15$ the same two orders take 9.4 minutes and 15.4. Below the threshold a bigger order is a longer sale; above it, a bigger order is only a few minutes more.
To put numbers on the toy, it needs the outside volume $V$ and the echo $m$. The report gives two times: about 35,000 contracts sold by 2:45, 13 minutes in, and all 75,000 by about 2:51, 19 minutes in. At 9%, the first of these means the market traded about 30,000 contracts a minute on average over those 13 minutes. Fitted to both times, the toy needs an outside volume of about 4,060 contracts a minute and $m = 10.25$, a hair above the threshold. Shifting the report’s round numbers (34,000 or 36,000 contracts by 2:45, 19 or 20 minutes in all) moves the fitted $m$ between 9.6 and 10.4, on both sides of it.
Two numbers fitted with two unknowns prove nothing about $m$ on the day. What the fit shows is the shape of the report’s timetable: a pace that kept climbing, which is what a loop at its edge does, and not one that settled. The fit is also generous to the fund’s own echo, because it lends all the extra volume to the fund’s contracts while other sellers were busy too. The toy trades 48,000 to 62,000 contracts a minute between 2:41 and 2:45; the report’s figures for the high-frequency traders alone, nearly 140,000 contracts between 2:41 and 2:44, over 33% of the volume, put the real market at up to about 106,000 a minute.
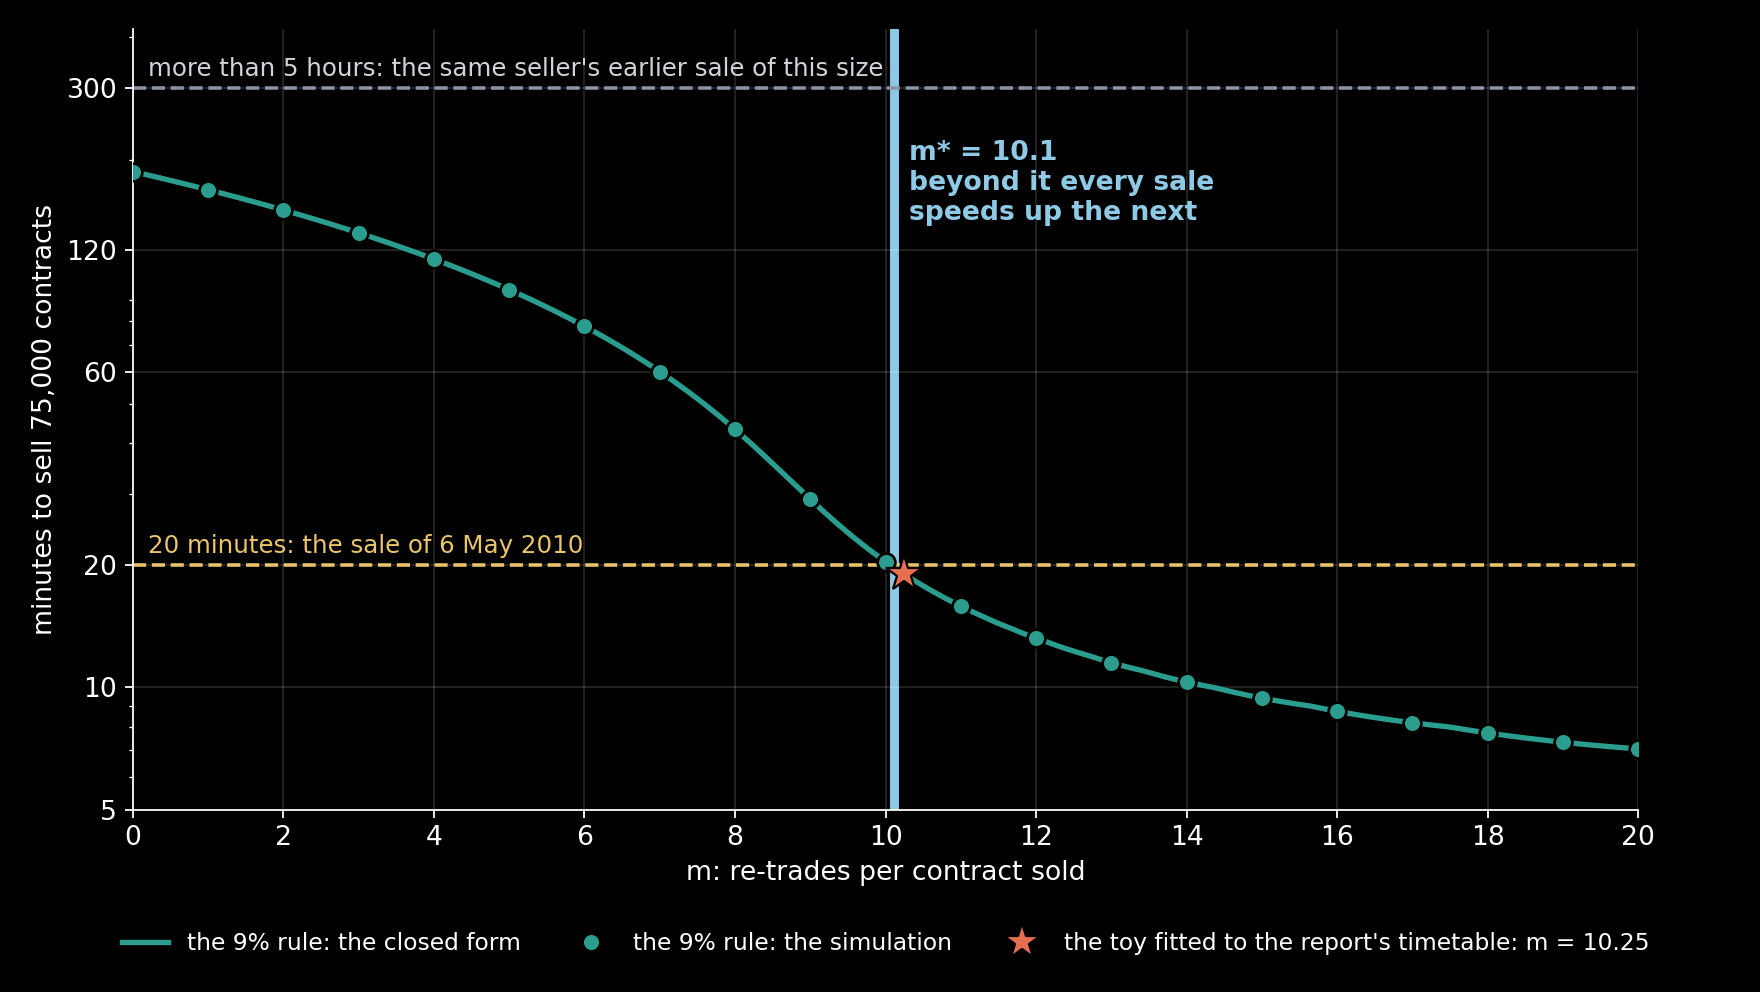
The curve passes through the threshold without a break. For an order of a fixed size nothing snaps at $m^*$; what changes is the shape of the pace, settling on one side and running away on the other. With no echo at all the toy’s 9% rule would take 187 minutes, about three hours.
Three Ways to Sell 75,000
The toy needs a price too. In it, only net selling moves the price: each contract the fund sells pushes the price down a little, and the dent fades as buyers come back, by a factor of $e$ every 10 minutes. The re-trades add volume but no net selling, so they move the price only by making the rule sell faster. The size of the push is set so that the 9% rule, at the fitted $m$, takes the price 5.0% down, the size of the report’s fall of “more than 5%” between 2:41 and 2:45:27. That works out at 0.109% for every 1,000 contracts sold at once. It hands the whole fall to one seller, which the report does not do; it fixes the scale of the toy and nothing more. The fade time and the push are both assumed.
On that toy market I sold the same 75,000 contracts three ways:
- The 9% rule: 9% of the previous minute’s volume, as on the day.
- An even schedule: 250 contracts a minute for five hours.
- The 9% rule with a brake: the same, except that it sells nothing in a minute that follows a minute in which the price fell more than 0.25%. The 0.25% is assumed; the 9% rule’s fastest minute at the fitted $m$ falls 0.42%.
Algorithm — Three Ways to Sell 75,000 Contracts in a Toy Market
input:  p = 0.09, the order Q = 75,000, re-trades m
fit V and m: the closed form sells 35,000 in 13 minutes
    and 75,000 in 19                   (the report's timetable)
λ ← set so the 9% rule at the fitted m falls 5.0% at worst
fade ← e^(−1/10) per minute            (assumed)
for each minute t = 1, 2, 3, …:
    want ← (a) p × the volume of minute t − 1
           (b) Q / 300
           (c) 0 if the price fell more than 0.25% in minute t − 1,
               else p × the volume of minute t − 1
    sale ← the smaller of want and what is left to sell
    volume of minute t ← V + (1 + m) × sale
    dent ← fade × dent + λ × sale      (net selling only)
    shortfall ← shortfall + sale × (fade × the last dent + λ × sale / 2)
check: (a)'s sale in every full minute against the closed form
output: minutes to finish, the deepest dent, and the shortfall / Q:
    the average price received below the start, in basis points
The check passes to rounding: over 401 values of $m$ from 0 to 20, the simulation’s sale in every full minute matches the closed form to within one part in $10^{13}$, and the minutes to finish agree to within $10^{-11}$ of a minute.
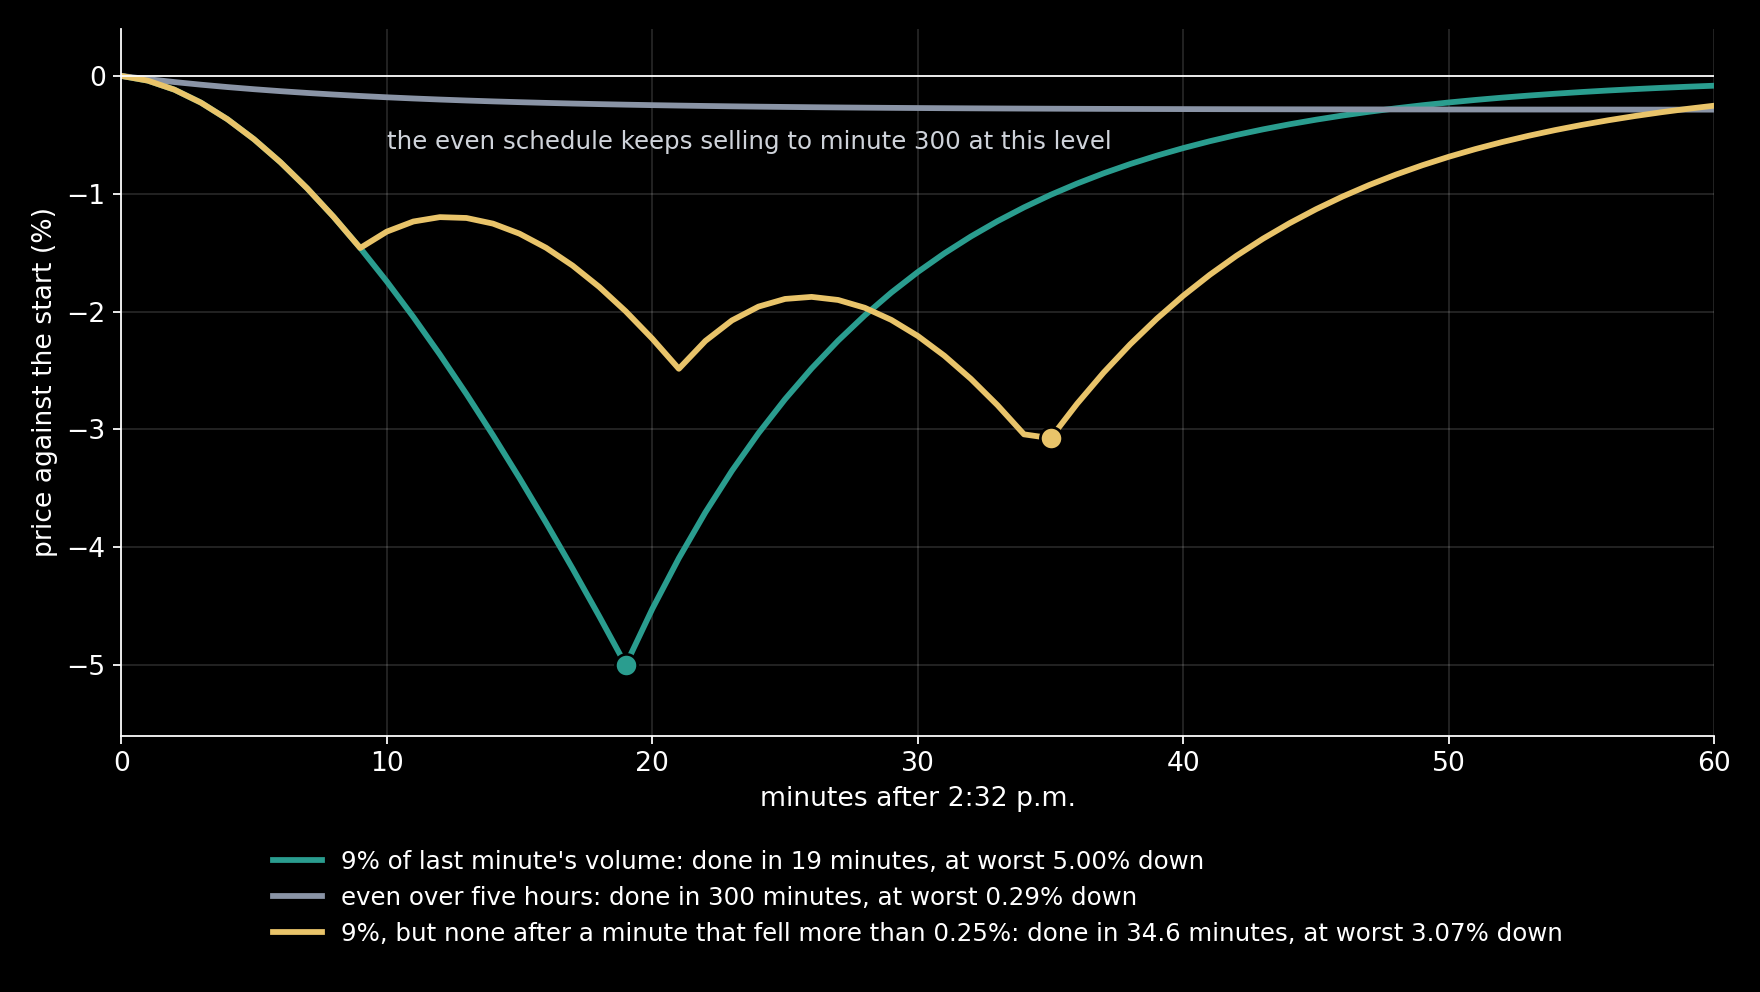
At the fitted $m$, just above the threshold, the 9% rule sold everything in 19 minutes, took the price 5.00% down at worst and received an average price 263 basis points below the start. The brake stretched the sale to 34.6 minutes, held the fall to 3.07% and cost 173 basis points. It stopped selling for only two minutes, and that was enough, because a minute with no sale is a minute with no echo: the next sale starts again from the outside volume alone, and the loop has to build up from the beginning. The even schedule took its full five hours, never pushed the price more than 0.29% down and cost 26 basis points.
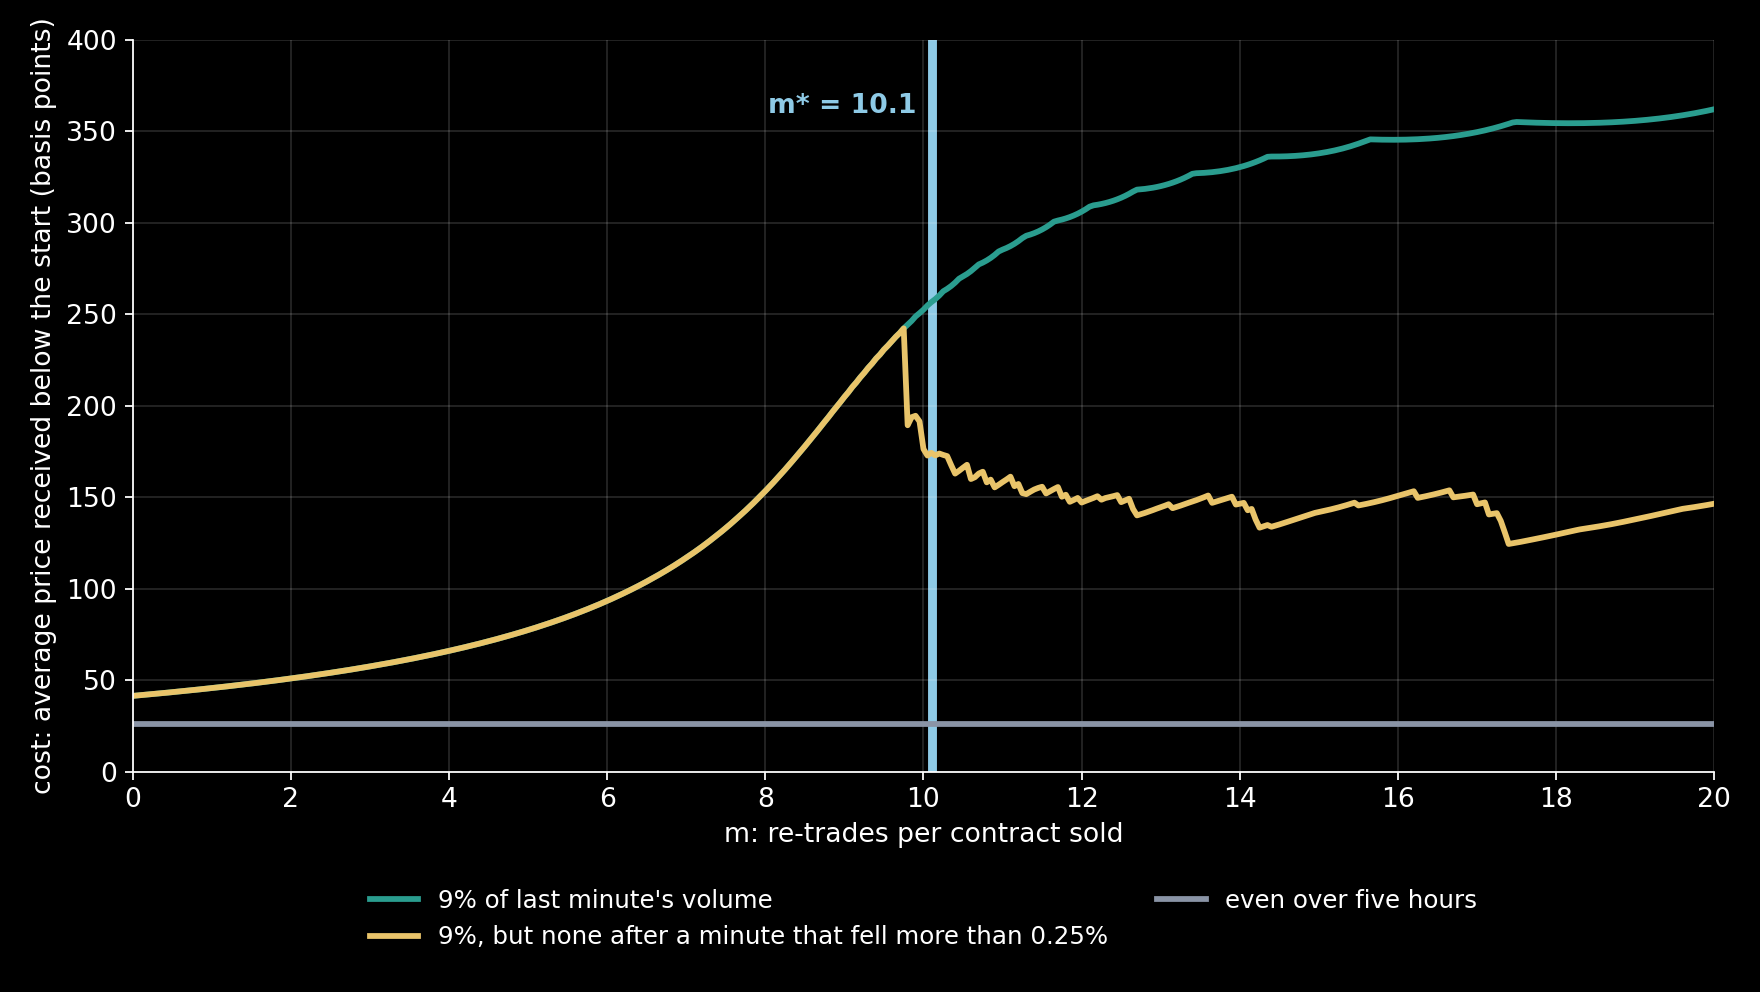
Across $m$ the pattern holds. Below the threshold the price never falls fast enough to touch the brake, which first acts at $m = 9.8$, and there the two rules are the same rule. Above it they part: at $m = 15$ the 9% rule sells everything in 9.4 minutes, takes the price 6.68% down and costs 338 basis points, while the brake takes 45.9 minutes, holds the fall to 2.15% and costs 142. The even schedule costs 26 basis points whatever $m$ is, because its sales do not depend on volume. A looser brake, at 0.5% a minute, first acts at $m = 10.55$, and at $m$ = 11, 12, 15 and 20 it holds the fall between 3.6% and 3.8%.
One caution belongs next to these numbers. The toy has no news and no other sellers, so waiting costs nothing in it, and that flatters the slow rule. A real seller who takes five hours carries five hours of risk that the market moves for other reasons, which is why traders pay for speed. The threshold is exact; the costs are an illustration of what it does.
What Stopped It
At 2:45:28 the CME’s Stop Logic Functionality paused trading in the E-mini for five seconds, “in order to prevent a cascade of further price declines”. In the report’s words, “In that short period of time, sell-side pressure in the E-Mini was partly alleviated and buy-side interest increased. When trading resumed at 2:45:33 p.m., prices stabilized and shortly thereafter, the E-Mini began to recover.” Buy orders “began arriving sometime during and after the 5 second pause in trading”.
The fund’s algorithm did not stop. It “continued to execute the sell program until about 2:51 p.m. as prices were rising”, and sold the remaining 40,000 or so into a market that was climbing back. Five seconds with no trading did for the market what the brake does in the toy, from the outside: for five seconds there was no volume to echo, and when trading came back, so had the buyers. The toy cannot show that part. Its buyers return at a fixed rate; on the day they came back all at once.
The report does not blame the fund alone, and neither does this post. Before the plunge the major indices were already down more than 4% on the day, and by 2:30 the buy-side depth of the E-mini had fallen from nearly $6 billion in the morning to $2.65 billion, a 55% decline; the sale began “against this backdrop of unusually high volatility and thinning liquidity”. Between 2:32 and 2:45 all the fundamental sellers together sold more than 80,000 contracts net, the fund among them. Andrei Kirilenko, Albert Kyle, Mehrdad Samadi and Tugkan Tuzun, studying the E-mini’s audit trail for that day and the three days before, found that “the trading pattern of the most active nondesignated intraday intermediaries (classified as High-Frequency Traders) did not change when prices fell during the Flash Crash”. Their way of trading did not change; on that afternoon, with too few buyers who would hold, it was what fed the rule. The 9% rule amplified the fall. It did not make it on its own.
A Rule With No Clock
The staffs’ report put its first lesson in a sentence: “under stressed market conditions, the automated execution of a large sell order can trigger extreme price movements, especially if the automated execution algorithm does not take prices into account”. The loop adds a number to that sentence. A rule that follows volume borrows its patience from the market, and when each contract it sells is passed on about ten times, the market has none to lend.
The fund’s earlier sale of the same size took more than five hours, with people in the loop and rules that watched the price and the clock. On 6 May the clock and the price were left out. The report describes the choice every large seller makes in plain words: “Effectively, a customer must make a choice as to how much human judgment is involved while executing a trade.”
Sources
- Staffs of the U.S. Commodity Futures Trading Commission and the U.S. Securities and Exchange Commission, “Findings Regarding the Market Events of May 6, 2010”, Report to the Joint Advisory Committee on Emerging Regulatory Issues, 30 September 2010.
- A. Kirilenko, A. S. Kyle, M. Samadi and T. Tuzun, “The Flash Crash: High-Frequency Trading in an Electronic Market”, The Journal of Finance 72 (2017) 967–998, doi:10.1111/jofi.12498.
The facts of 6 May 2010 are quoted from the staffs’ report. The recurrence, its closed form, the toy market and every number in the text and the charts are computed by the script archived with this post, from results saved once.
Interested in applying these ideas to your work? Get in touch.