
The Lead That Never Changes Hands
A Race With No Favourite
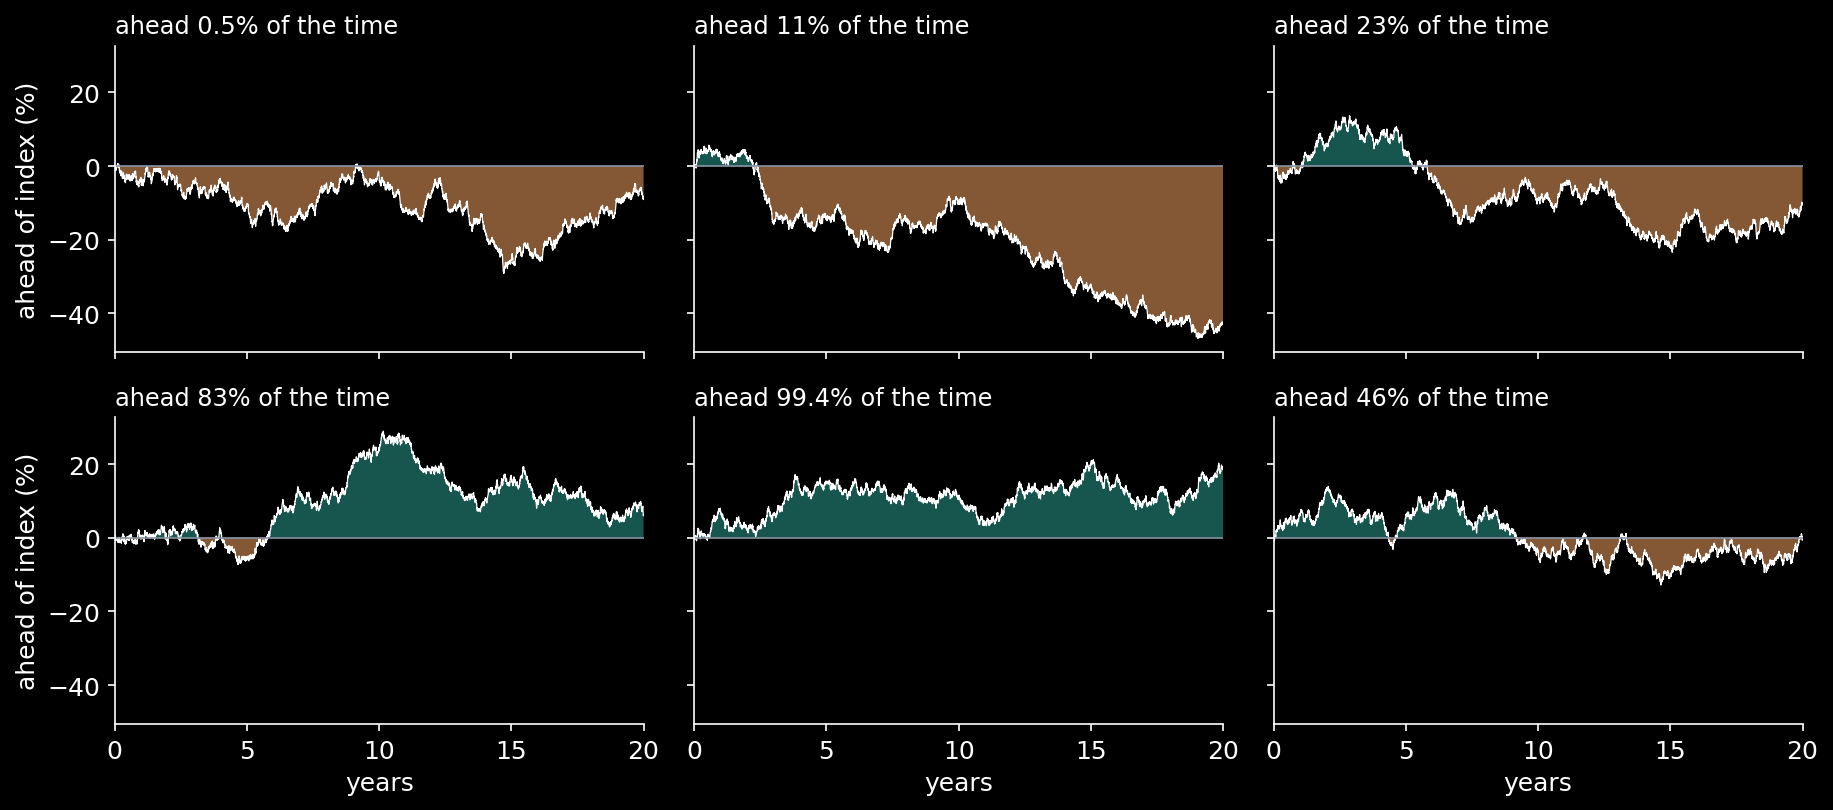
Hire a fund manager with no skill at all. Every day the fund beats its index or trails it by a little luck, and over
twenty years neither side is favoured. How much of those twenty years should the fund spend ahead of the index? Half,
says intuition, give or take a few years.
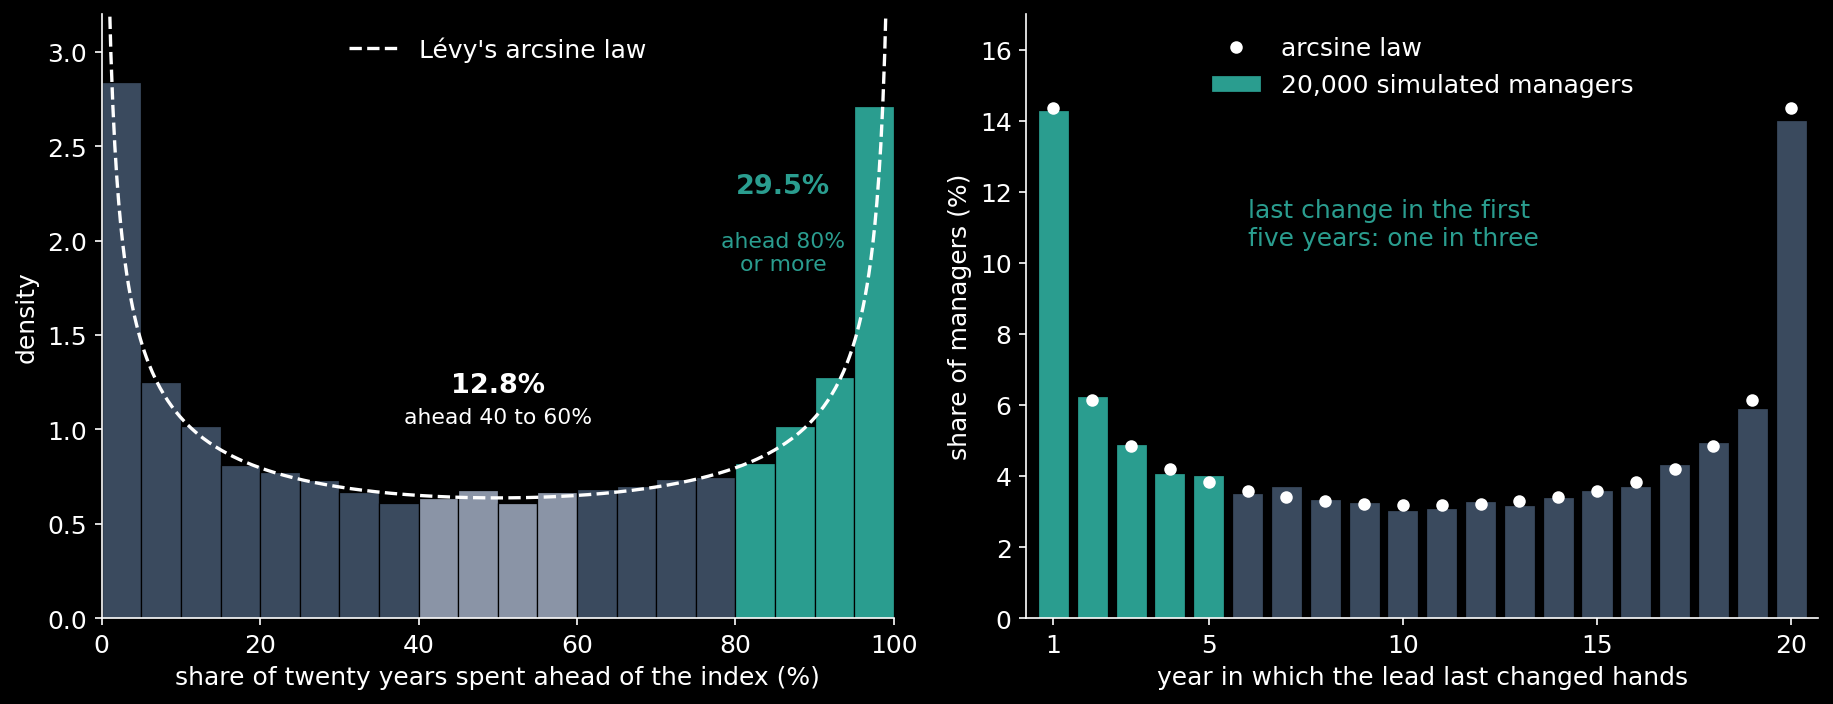
Half is the least likely answer. With probability 29.5% the fund spends at least 80% of the twenty years ahead of its
index, and with the same probability it spends at least 80% of them behind. A record that looks fair, ahead for between
40% and 60% of the time, turns up only 12.8% of the time. A manager who has been ahead of the market for sixteen of the
last twenty years has shown you something a coin does three times in ten.

The Law
Write $X_t$ for the logarithm of the fund’s value divided by the index’s. With no skill it is a Brownian motion with no
drift, scaled by the tracking error $s$: $X_t = s\,W_t$. The share of the time the fund spends ahead is $A_T$, and Paul
Lévy found its distribution exactly:
Neither the tracking error nor the horizon appears. Stretch time by any factor and the path by its square root, and a
Brownian motion is still a Brownian motion; the share of time it spends above zero notices neither change. The law is the
same for a fund that hugs its index and for one that strays far from it, over one year or fifty.
Its density, $1/\big(\pi\sqrt{x(1-x)}\big)$, is shaped like a U: infinite at both ends and lowest in the middle. The chance of spending at least 80% of the
time ahead is $1 – \tfrac{2}{\pi}\arcsin\sqrt{0.8} = 29.5\%$, and of at least 90%, 20.5%. One side or the other leads for
four-fifths of the time in 59% of all histories. A record ahead four-fifths of the time is 2.3 times as likely as a
record ahead about half the time.
Why the Middle Is Empty
A lead, once opened, takes a long time to close. The time a fair game takes to come back to a tie has a tail that falls
only like one over the square root of the time, so slowly that its average is infinite. Ties come in clusters early on,
and then the gaps between them grow without limit. Most histories settle on one side and stay there.
Lévy found the same curve twice more. The last time the lead changed hands, $g_T$, has the same law, and so does the time
at which the fund was furthest ahead:
Over twenty years, there is a one-in-three chance that the lead last changed hands in the first five, and that whoever led
then has led for fifteen years straight. The last change falls in the first year with probability 14.4%, and in the tenth
and eleventh years together with probability only 6.4%. The fund’s best moment against its index is just as lopsided:
more than twice as likely to come in the first year as in those two middle years.
Any Coin Will Do
The law does not need Brownian motion, or normal returns. Paul Erdős and Mark Kac showed in 1947 that it holds in the
limit for long sums of independent steps. Erik Sparre Andersen proved more in 1953: for independent steps drawn from any
symmetric continuous distribution, the number $N_n$ of the $n$ running totals that are positive has one
and the same law, exactly, whatever the number of steps:
This is not a limit and not an approximation. Fat tails and crashes do not change it, so long as good luck and bad luck
are equally likely. Counted over 240 months, the chance of being ahead for at least 80% of them is 29.7%; over 5,040
trading days, 29.5%. Simulated with normal daily steps it comes out at 29.2%, and with the fat tails of a Student $t$
distribution with three degrees of freedom, 29.4%.
William Feller, who made the coin-tossing version famous, put it as two players tossing a coin once a second for a year.
In one year out of twenty, one of the two is ahead for all but thirteen and a half hours of it.
This is the code that checks every number in this post. It computes the laws, sums the exact one for months and for days,
and simulates 20,000 managers with normal and with fat-tailed steps:
Python 3.13 — The Arcsine Law, Exact and Simulated
import numpy as np
from math import asin, ceil, comb, pi, sin, sqrt

def arcsine(x):
    """Levy's law: P(share of the time ahead <= x)"""
    return 2 / pi * asin(sqrt(x))

print(f"ahead 80% of the time or more: {1 - arcsine(0.8):.1%}")
print(f"ahead 40 to 60% of the time: {arcsine(0.6) - arcsine(0.4):.1%}")
print(f"lead last changed hands in the first 5 of 20 years: {arcsine(5 / 20):.4f}")

def exact_ahead(n, share):
    """P(at least `share` of n running totals are positive),
    exact for ANY symmetric continuous steps (Sparre Andersen)"""
    ks = range(ceil(share * n), n + 1)
    return sum(comb(2*k, k) * comb(2*(n - k), n - k) for k in ks) / 4**n

print(f"exact, 240 months: {exact_ahead(240, 0.8):.1%}")
print(f"exact, 5,040 days: {exact_ahead(5040, 0.8):.1%}")

# 20,000 managers with no skill, twenty years of trading days,
# with normal and with fat-tailed (Student t, 3 degrees) daily steps
rng = np.random.default_rng(20260604)
normal, fat = [], []
for _ in range(20):                                 # batches of 1,000
    S = np.cumsum(rng.standard_normal((1000, 5040)), axis=1)
    normal.append((S > 0).mean(axis=1))
    S = np.cumsum(rng.standard_t(3, (1000, 5040)), axis=1)
    fat.append((S > 0).mean(axis=1))
for name, runs in (("normal", normal), ("Student t", fat)):
    ahead = np.concatenate(runs)
    top = np.mean(ahead >= 0.8)
    middle = np.mean((ahead >= 0.4) & (ahead <= 0.6))
    print(f"{name} steps: ahead 80% or more {top:.1%}, 40 to 60% {middle:.1%}")

# Feller's coin, tossed once a second for a year: in one year out of
# twenty, one player is behind for less than
print(f"{sin(pi / 80)**2 * 365 * 24:.1f} hours")

# ahead 80% of the time or more: 29.5%
# ahead 40 to 60% of the time: 12.8%
# lead last changed hands in the first 5 of 20 years: 0.3333
# exact, 240 months: 29.7%
# exact, 5,040 days: 29.5%
# normal steps: ahead 80% or more 29.2%, 40 to 60% 13.0%
# Student t steps: ahead 80% or more 29.4%, 40 to 60% 13.1%
# 13.5 hours
What a Long Lead Proves
Give a hundred managers no skill whatsoever, and about thirty of them will have been ahead of the market for sixteen of
the last twenty years, while another thirty will have trailed it for as long. Yet at the end of the twenty years each is
ahead with probability exactly one half. The share of time spent ahead is the wrong statistic: it counts one early stroke
of luck again for every year the lead survives.
What a record can show is where the race ends: the final margin, measured against the tracking error times the square root
of the years. That is a question about the drift of a random walk, and it takes decades to answer, which is the subject of
the previous post.

In a fair game, the lead that never changes hands is not a sign that the game is unfair. It is what a fair game looks like.
Sources
- P. Lévy, “Sur certains processus stochastiques homogènes”, Compositio Mathematica 7 (1940) 283–339.
- P. Erdős and M. Kac, “On the number of positive sums of independent random variables”, Bulletin of the American Mathematical Society 53 (1947) 1011–1020.
- K. L. Chung and W. Feller, “On fluctuations in coin-tossing”, Proceedings of the National Academy of Sciences 35 (1949) 605–608.
- E. Sparre Andersen, “On the fluctuations of sums of random variables”, Mathematica Scandinavica 1 (1953) 263–285.
- W. Feller, An Introduction to Probability Theory and Its Applications, Volume I, third edition, Wiley (1968).
- P. Mörters and Y. Peres, Brownian Motion, Cambridge University Press (2010).
Every number in the text and both charts are computed by the scripts archived with this post: the closed forms and the exact discrete law, each checked against a Monte Carlo of 20,000 simulated managers, saved once.
Interested in applying these ideas to your work? Get in touch.