The Trade War Nobody Chose: Smoot-Hawley and the Model That Would Have Stopped It
A Thousand Economists Walk Into a Room
In May 1930, over a thousand American economists signed a petition and sent it to the White House. The letter was unusually direct for academics: do not sign this bill. It will cause retaliatory tariffs from other nations, destroy export markets, raise prices for American consumers, and deepen the depression you are trying to fix.
Herbert Hoover signed the Smoot-Hawley Tariff Act on June 17, 1930 anyway.
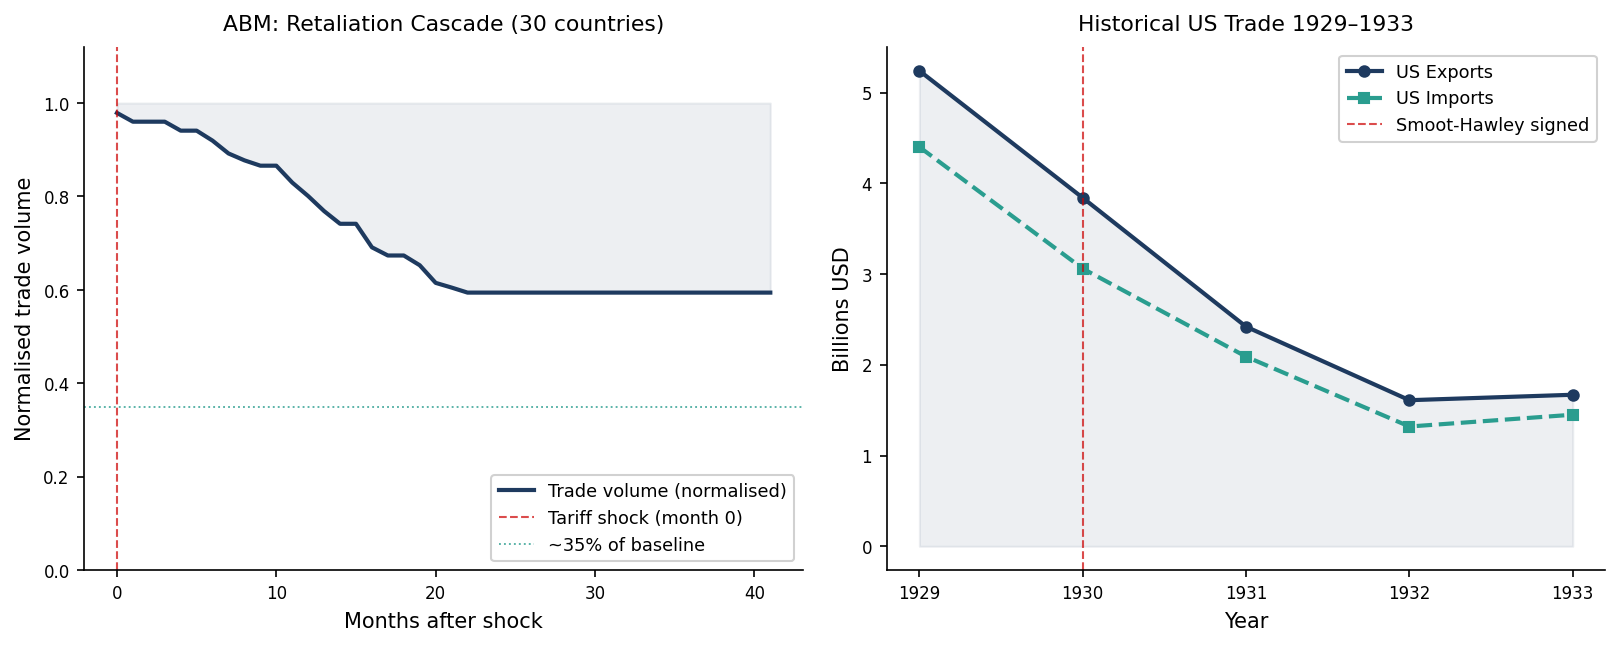
Within months, Canada, Britain, France, Germany, and two dozen other countries raised their own tariffs in response. US exports collapsed. Global trade fell by 65% in three years. The Great Depression, already bad, became catastrophic.
The economists were right. But being right was not enough. What they lacked was a tool that could show *how fast* it would happen, *how far* it would spread, and *why* the damage would be irreversible once it started.
What the Decision-Makers Assumed
The logic behind Smoot-Hawley was linear. American farmers and manufacturers were struggling. Higher tariffs meant cheaper domestic goods would win against imports. Jobs would be protected. Recovery would follow.
It is the logic of a closed system. Raise the wall, keep the money in.
The problem is that economies are not closed systems. They are networks. Every trading relationship is an edge between two nodes, and every node has a breaking point — a threshold beyond which the rational response is retaliation. The architects of Smoot-Hawley modelled the US economy. They forgot to model everyone else.
What an Agent-Based Model Would Have Shown
Build the simplest possible ABM. Nodes are countries. Edges are trade relationships, weighted by volume. Each country has a retaliation threshold — the tariff level beyond which it responds in kind. Start with the US raising tariffs by 20% across the board.
Watch what happens.
The UK hits its threshold in month two. Canada in month three — Canada, whose entire export economy runs on the US border. France, Germany, Australia follow. Each retaliation triggers a second round. Countries that were not directly targeted by the US find their own exports collapsing because their trading partners are now poorer and more protectionist. The cascade is not linear. It is exponential in the early stages, then it plateaus when there is nothing left to retaliate with.
$(1)$
Country $i$ raises its tariff by $\rho_i$ in the next period if the weighted tariff pressure from its neighbours exceeds its threshold $\tau_i$. That is the whole model. Three parameters per country. No equilibrium assumption. No representative agent. Just local rules and a network.
The emergent behaviour — a global trade war nobody individually chose — falls out automatically.
The Numbers
US exports in 1929: 5.2 billion dollars. By 1932: 1.6 billion. A 70% collapse in three years. US imports fell by a similar magnitude. The world did not become more self-sufficient. It became more impoverished.
The Smoot-Hawley tariff itself did not cause the Great Depression. The Depression was already underway. What the tariff did was turn a national crisis into a global one by destroying the trade network that might otherwise have cushioned the shock.
GDP in the US fell 30% between 1929 and 1933. Unemployment hit 25%. The recovery took a decade and a world war.
For want of a simulation. Here is the one that should have been on Hoover’s desk.
Algorithm — Trade Retaliation Cascade — Agent-Based Model
Input:
  Countries C = {c_0, c_1, ..., c_n}           // c_0 = US
  Trade matrix W[i][j]                           // bilateral trade volume
  Retaliation threshold tau[i]                   // tariff pressure to trigger retaliation
  Retaliation magnitude rho[i]                   // own tariff hike if triggered
  Initial shock: delta_T[0] = 0.20              // US raises tariffs 20%
  Horizon: T months

Initialise:
  delta_T[i] = 0  for all i != 0
  retaliated[i] = False  for all i
  trade_volume[0] = 1.0

For each month t = 1 to T:
  For each country i not yet retaliated:
    pressure[i] = sum over j of W[i][j] * delta_T[j]
    If pressure[i] >= tau[i]:
      delta_T[i] = rho[i]
      retaliated[i] = True

  mean_tariff = average of delta_T over all countries
  trade_volume[t] = exp(-k * mean_tariff)        // k calibrated to historical data

Output:
  trade_volume[0..T]                             // projected global trade collapse
  retaliated[0..n]                               // which countries retaliated and when
  If trade_volume[T] < threshold: WARN — cascade is irreversible
The algorithm is deliberately simple. The insight it delivers is not: once enough nodes cross their retaliation threshold, the mean tariff rises, trade volume collapses further, and the remaining nodes are pushed over their own thresholds. The cascade feeds itself. There is no equilibrium on the way down.
Run this in June 1930, before the signature. The output would have been a single number: **trade collapses to 35% of baseline within three years**. One page. One chart. One decision reconsidered.
The Topology Does Not Change
Here is the uncomfortable part.
The network structure of global trade in 2025 is not fundamentally different from 1930. The nodes are different, the edge weights have shifted, the thresholds have been recalibrated by decades of multilateral agreements. But the underlying dynamics — local retaliation rules, cascade propagation, irreversible network damage once enough edges are severed — are identical.
Any ABM built on 2025 trade data, with 2025 retaliation thresholds estimated from historical behaviour, run against a large unilateral tariff shock, would produce the same qualitative output it would have produced in 1930.
The model does not have a political opinion. It has a network topology. And the topology says: when you push a connected system hard enough at one node, the cascade does not stop at your border.
It never did.
Building a market simulation or calibration pipeline? I’d be glad to help.
